
 Yahoo Finance
 Is John Bean Technologies Corporation's (NYSE:JBT) Latest Stock Performance A Reflection Of Its Financial Health?
Most readers would already be aware that John Bean Technologies' (NYSE:JBT) stock increased significantly by 17% over the past three months. Given the company's impressive performance, we decided to study its financial indicators more closely as a company's financial health over the long-term usually dictates market outcomes. In this article, we decided to focus on John Bean Technologies' ROE.
ROE or return on equity is a useful tool to assess how effectively a company can generate returns on the investment it received from its shareholders. In other words, it is a profitability ratio which measures the rate of return on the capital provided by the company's shareholders.
View our latest analysis for John Bean Technologies
How To Calculate Return On Equity?
The formula for ROE is:
Return on Equity = Net Profit (from continuing operations) ÷ Shareholders' Equity
So, based on the above formula, the ROE for John Bean Technologies is:
20% = US$121m ÷ US$611m (Based on the trailing twelve months to September 2020).
The 'return' is the amount earned after tax over the last twelve months. One way to conceptualize this is that for each $1 of shareholders' capital it has, the company made $0.20 in profit.
What Is The Relationship Between ROE And Earnings Growth?
We have already established that ROE serves as an efficient profit-generating gauge for a company's future earnings. Based on how much of its profits the company chooses to reinvest or "retain", we are then able to evaluate a company's future ability to generate profits. Assuming everything else remains unchanged, the higher the ROE and profit retention, the higher the growth rate of a company compared to companies that don't necessarily bear these characteristics.
John Bean Technologies' Earnings Growth And 20% ROE
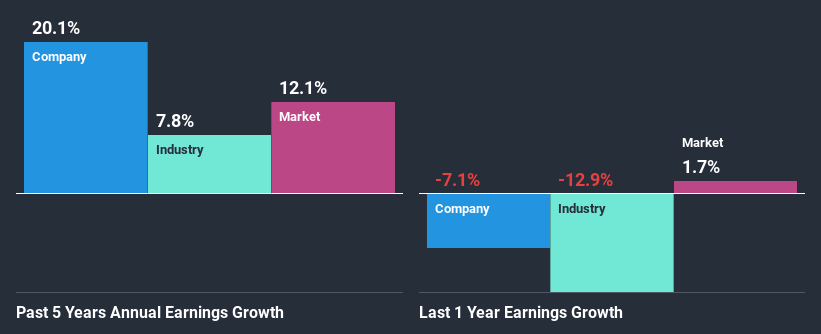
At first glance, John Bean Technologies seems to have a decent ROE. Especially when compared to the industry average of 11% the company's ROE looks pretty impressive. Probably as a result of this, John Bean Technologies was able to see an impressive net income growth of 20% over the last five years. We believe that there might also be other aspects that are positively influencing the company's earnings growth. For instance, the company has a low payout ratio or is being managed efficiently.
We then compared John Bean Technologies' net income growth with the industry and we're pleased to see that the company's growth figure is higher when compared with the industry which has a growth rate of 7.8% in the same period.
The basis for attaching value to a company is, to a great extent, tied to its earnings growth. It’s important for an investor to know whether the market has priced in the company's expected earnings growth (or decline). By doing so, they will have an idea if the stock is headed into clear blue waters or if swampy waters await. Is John Bean Technologies fairly valued compared to other companies? These 3 valuation measures might help you decide.
Is John Bean Technologies Efficiently Re-investing Its Profits?
John Bean Technologies has a really low three-year median payout ratio of 11%, meaning that it has the remaining 89% left over to reinvest into its business. So it looks like John Bean Technologies is reinvesting profits heavily to grow its business, which shows in its earnings growth.
Moreover, John Bean Technologies is determined to keep sharing its profits with shareholders which we infer from its long history of paying a dividend for at least ten years. Our latest analyst data shows that the future payout ratio of the company over the next three years is expected to be approximately 9.9%. Accordingly, forecasts suggest that John Bean Technologies' future ROE will be 19% which is again, similar to the current ROE.
Summary
Overall, we are quite pleased with John Bean Technologies' performance. In particular, it's great to see that the company is investing heavily into its business and along with a high rate of return, that has resulted in a sizeable growth in its earnings. We also studied the latest analyst forecasts and found that the company's earnings growth is expected be similar to its current growth rate. To know more about the latest analysts predictions for the company, check out this visualization of analyst forecasts for the company.
This article by Simply Wall St is general in nature. It does not constitute a recommendation to buy or sell any stock, and does not take account of your objectives, or your financial situation. We aim to bring you long-term focused analysis driven by fundamental data. Note that our analysis may not factor in the latest price-sensitive company announcements or qualitative material. Simply Wall St has no position in any stocks mentioned.
Have feedback on this article? Concerned about the content? Get in touch with us directly. Alternatively, email editorial-team (at) simplywallst.com.
