
 Yahoo Finance
 Investors Will Want Lookers' (LON:LOOK) Growth In ROCE To Persist
Finding a business that has the potential to grow substantially is not easy, but it is possible if we look at a few key financial metrics. In a perfect world, we'd like to see a company investing more capital into its business and ideally the returns earned from that capital are also increasing. This shows us that it's a compounding machine, able to continually reinvest its earnings back into the business and generate higher returns. With that in mind, we've noticed some promising trends at Lookers (LON:LOOK) so let's look a bit deeper.
Return On Capital Employed (ROCE): What is it?
If you haven't worked with ROCE before, it measures the 'return' (pre-tax profit) a company generates from capital employed in its business. To calculate this metric for Lookers, this is the formula:
Return on Capital Employed = Earnings Before Interest and Tax (EBIT) ÷ (Total Assets - Current Liabilities)
0.19 = UK£121m ÷ (UK£1.5b - UK£886m) (Based on the trailing twelve months to June 2021).
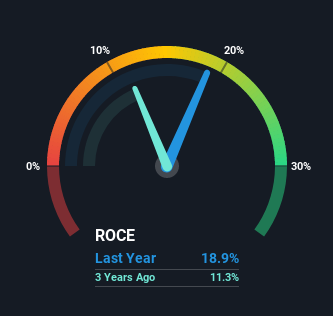
Therefore, Lookers has an ROCE of 19%. In absolute terms, that's a satisfactory return, but compared to the Specialty Retail industry average of 14% it's much better.
See our latest analysis for Lookers
Above you can see how the current ROCE for Lookers compares to its prior returns on capital, but there's only so much you can tell from the past. If you're interested, you can view the analysts predictions in our free report on analyst forecasts for the company.
What Can We Tell From Lookers' ROCE Trend?
We like the trends that we're seeing from Lookers. The numbers show that in the last five years, the returns generated on capital employed have grown considerably to 19%. Basically the business is earning more per dollar of capital invested and in addition to that, 22% more capital is being employed now too. The increasing returns on a growing amount of capital is common amongst multi-baggers and that's why we're impressed.
In another part of our analysis, we noticed that the company's ratio of current liabilities to total assets decreased to 58%, which broadly means the business is relying less on its suppliers or short-term creditors to fund its operations. So this improvement in ROCE has come from the business' underlying economics, which is great to see. However, current liabilities are still at a pretty high level, so just be aware that this can bring with it some risks.
Our Take On Lookers' ROCE
A company that is growing its returns on capital and can consistently reinvest in itself is a highly sought after trait, and that's what Lookers has. Astute investors may have an opportunity here because the stock has declined 34% in the last five years. So researching this company further and determining whether or not these trends will continue seems justified.
One more thing to note, we've identified 1 warning sign with Lookers and understanding this should be part of your investment process.
If you want to search for solid companies with great earnings, check out this free list of companies with good balance sheets and impressive returns on equity.
Have feedback on this article? Concerned about the content? Get in touch with us directly. Alternatively, email editorial-team (at) simplywallst.com.
This article by Simply Wall St is general in nature. We provide commentary based on historical data and analyst forecasts only using an unbiased methodology and our articles are not intended to be financial advice. It does not constitute a recommendation to buy or sell any stock, and does not take account of your objectives, or your financial situation. We aim to bring you long-term focused analysis driven by fundamental data. Note that our analysis may not factor in the latest price-sensitive company announcements or qualitative material. Simply Wall St has no position in any stocks mentioned.
