
 Yahoo Finance
 Investors Will Want China Gold International Resources' (TSE:CGG) Growth In ROCE To Persist
Finding a business that has the potential to grow substantially is not easy, but it is possible if we look at a few key financial metrics. In a perfect world, we'd like to see a company investing more capital into its business and ideally the returns earned from that capital are also increasing. Ultimately, this demonstrates that it's a business that is reinvesting profits at increasing rates of return. So on that note, China Gold International Resources (TSE:CGG) looks quite promising in regards to its trends of return on capital.
What is Return On Capital Employed (ROCE)?
Just to clarify if you're unsure, ROCE is a metric for evaluating how much pre-tax income (in percentage terms) a company earns on the capital invested in its business. To calculate this metric for China Gold International Resources, this is the formula:
Return on Capital Employed = Earnings Before Interest and Tax (EBIT) ÷ (Total Assets - Current Liabilities)
0.10 = US$308m ÷ (US$3.3b - US$360m) (Based on the trailing twelve months to September 2021).
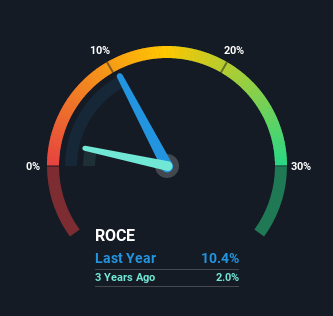
Therefore, China Gold International Resources has an ROCE of 10%. In absolute terms, that's a satisfactory return, but compared to the Metals and Mining industry average of 3.3% it's much better.
Check out our latest analysis for China Gold International Resources
In the above chart we have measured China Gold International Resources' prior ROCE against its prior performance, but the future is arguably more important. If you're interested, you can view the analysts predictions in our free report on analyst forecasts for the company.
What The Trend Of ROCE Can Tell Us
Investors would be pleased with what's happening at China Gold International Resources. The data shows that returns on capital have increased substantially over the last five years to 10%. The amount of capital employed has increased too, by 38%. This can indicate that there's plenty of opportunities to invest capital internally and at ever higher rates, a combination that's common among multi-baggers.
On a related note, the company's ratio of current liabilities to total assets has decreased to 11%, which basically reduces it's funding from the likes of short-term creditors or suppliers. This tells us that China Gold International Resources has grown its returns without a reliance on increasing their current liabilities, which we're very happy with.
Our Take On China Gold International Resources' ROCE
In summary, it's great to see that China Gold International Resources can compound returns by consistently reinvesting capital at increasing rates of return, because these are some of the key ingredients of those highly sought after multi-baggers. Since the stock has only returned 33% to shareholders over the last five years, the promising fundamentals may not be recognized yet by investors. So with that in mind, we think the stock deserves further research.
On a final note, we've found 1 warning sign for China Gold International Resources that we think you should be aware of.
While China Gold International Resources isn't earning the highest return, check out this free list of companies that are earning high returns on equity with solid balance sheets.
Have feedback on this article? Concerned about the content? Get in touch with us directly. Alternatively, email editorial-team (at) simplywallst.com.
This article by Simply Wall St is general in nature. We provide commentary based on historical data and analyst forecasts only using an unbiased methodology and our articles are not intended to be financial advice. It does not constitute a recommendation to buy or sell any stock, and does not take account of your objectives, or your financial situation. We aim to bring you long-term focused analysis driven by fundamental data. Note that our analysis may not factor in the latest price-sensitive company announcements or qualitative material. Simply Wall St has no position in any stocks mentioned.
