
 Yahoo Finance
 Investors in Tejon Ranch (NYSE:TRC) have unfortunately lost 27% over the last five years
Ideally, your overall portfolio should beat the market average. But in any portfolio, there will be mixed results between individual stocks. So we wouldn't blame long term Tejon Ranch Co. (NYSE:TRC) shareholders for doubting their decision to hold, with the stock down 27% over a half decade. Furthermore, it's down 20% in about a quarter. That's not much fun for holders. But this could be related to the weak market, which is down 13% in the same period.
With that in mind, it's worth seeing if the company's underlying fundamentals have been the driver of long term performance, or if there are some discrepancies.
See our latest analysis for Tejon Ranch
To quote Buffett, 'Ships will sail around the world but the Flat Earth Society will flourish. There will continue to be wide discrepancies between price and value in the marketplace...' By comparing earnings per share (EPS) and share price changes over time, we can get a feel for how investor attitudes to a company have morphed over time.
During five years of share price growth, Tejon Ranch moved from a loss to profitability. That would generally be considered a positive, so we are surprised to see the share price is down. Other metrics might give us a better handle on how its value is changing over time.
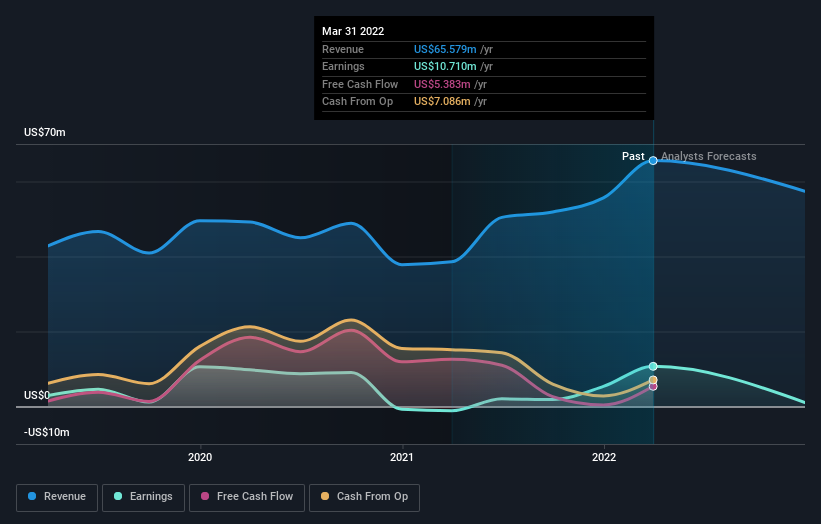
Revenue is actually up 7.4% over the time period. So it seems one might have to take closer look at the fundamentals to understand why the share price languishes. After all, there may be an opportunity.
You can see how earnings and revenue have changed over time in the image below (click on the chart to see the exact values).
We know that Tejon Ranch has improved its bottom line over the last three years, but what does the future have in store? If you are thinking of buying or selling Tejon Ranch stock, you should check out this FREE detailed report on its balance sheet.
A Different Perspective
While it's certainly disappointing to see that Tejon Ranch shares lost 1.5% throughout the year, that wasn't as bad as the market loss of 16%. Of far more concern is the 5% p.a. loss served to shareholders over the last five years. While the losses are slowing we doubt many shareholders are happy with the stock. Is Tejon Ranch cheap compared to other companies? These 3 valuation measures might help you decide.
If you like to buy stocks alongside management, then you might just love this free list of companies. (Hint: insiders have been buying them).
Please note, the market returns quoted in this article reflect the market weighted average returns of stocks that currently trade on US exchanges.
Have feedback on this article? Concerned about the content? Get in touch with us directly. Alternatively, email editorial-team (at) simplywallst.com.
This article by Simply Wall St is general in nature. We provide commentary based on historical data and analyst forecasts only using an unbiased methodology and our articles are not intended to be financial advice. It does not constitute a recommendation to buy or sell any stock, and does not take account of your objectives, or your financial situation. We aim to bring you long-term focused analysis driven by fundamental data. Note that our analysis may not factor in the latest price-sensitive company announcements or qualitative material. Simply Wall St has no position in any stocks mentioned.
Join A Paid User Research Session
You’ll receive a US$30 Amazon Gift card for 1 hour of your time while helping us build better investing tools for the individual investors like yourself. Sign up here
