
 Yahoo Finance
 Investors Still Waiting For A Pull Back In Enterprise Group, Inc. (TSE:E)
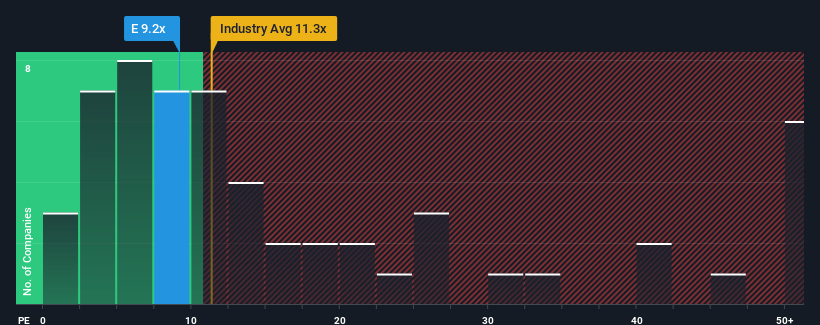
There wouldn't be many who think Enterprise Group, Inc.'s (TSE:E) price-to-earnings (or "P/E") ratio of 9.2x is worth a mention when the median P/E in Canada is similar at about 11x. Although, it's not wise to simply ignore the P/E without explanation as investors may be disregarding a distinct opportunity or a costly mistake.
With earnings growth that's inferior to most other companies of late, Enterprise Group has been relatively sluggish. One possibility is that the P/E is moderate because investors think this lacklustre earnings performance will turn around. If not, then existing shareholders may be a little nervous about the viability of the share price.
Check out our latest analysis for Enterprise Group
Keen to find out how analysts think Enterprise Group's future stacks up against the industry? In that case, our free report is a great place to start.
How Is Enterprise Group's Growth Trending?
In order to justify its P/E ratio, Enterprise Group would need to produce growth that's similar to the market.
Retrospectively, the last year delivered virtually the same number to the company's bottom line as the year before. The longer-term trend has been no better as the company has no earnings growth to show for over the last three years either. Therefore, it's fair to say that earnings growth has definitely eluded the company recently.
Turning to the outlook, the next year should generate growth of 7.9% as estimated by the lone analyst watching the company. That's shaping up to be similar to the 7.0% growth forecast for the broader market.
In light of this, it's understandable that Enterprise Group's P/E sits in line with the majority of other companies. It seems most investors are expecting to see average future growth and are only willing to pay a moderate amount for the stock.
The Bottom Line On Enterprise Group's P/E
We'd say the price-to-earnings ratio's power isn't primarily as a valuation instrument but rather to gauge current investor sentiment and future expectations.
As we suspected, our examination of Enterprise Group's analyst forecasts revealed that its market-matching earnings outlook is contributing to its current P/E. At this stage investors feel the potential for an improvement or deterioration in earnings isn't great enough to justify a high or low P/E ratio. It's hard to see the share price moving strongly in either direction in the near future under these circumstances.
Don't forget that there may be other risks. For instance, we've identified 3 warning signs for Enterprise Group that you should be aware of.
If you're unsure about the strength of Enterprise Group's business, why not explore our interactive list of stocks with solid business fundamentals for some other companies you may have missed.
Have feedback on this article? Concerned about the content? Get in touch with us directly. Alternatively, email editorial-team (at) simplywallst.com.
This article by Simply Wall St is general in nature. We provide commentary based on historical data and analyst forecasts only using an unbiased methodology and our articles are not intended to be financial advice. It does not constitute a recommendation to buy or sell any stock, and does not take account of your objectives, or your financial situation. We aim to bring you long-term focused analysis driven by fundamental data. Note that our analysis may not factor in the latest price-sensitive company announcements or qualitative material. Simply Wall St has no position in any stocks mentioned.
Join A Paid User Research Session
You’ll receive a US$30 Amazon Gift card for 1 hour of your time while helping us build better investing tools for the individual investors like yourself. Sign up here
