
 Yahoo Finance
 Investors in SNDL (NASDAQ:SNDL) have unfortunately lost 85% over the last three years
SNDL Inc. (NASDAQ:SNDL) shareholders should be happy to see the share price up 13% in the last month. But that doesn't change the fact that the returns over the last three years have been stomach churning. In that time the share price has melted like a snowball in the desert, down 85%. So we're relieved for long term holders to see a bit of uplift. But the more important question is whether the underlying business can justify a higher price still. We really feel for shareholders in this scenario. It's a good reminder of the importance of diversification, and it's worth keeping in mind there's more to life than money, anyway.
So let's have a look and see if the longer term performance of the company has been in line with the underlying business' progress.
See our latest analysis for SNDL
SNDL wasn't profitable in the last twelve months, it is unlikely we'll see a strong correlation between its share price and its earnings per share (EPS). Arguably revenue is our next best option. Generally speaking, companies without profits are expected to grow revenue every year, and at a good clip. Some companies are willing to postpone profitability to grow revenue faster, but in that case one does expect good top-line growth.
In the last three years, SNDL saw its revenue grow by 72% per year, compound. That is faster than most pre-profit companies. So on the face of it we're really surprised to see the share price down 23% a year in the same time period. You'd want to take a close look at the balance sheet, as well as the losses. Ultimately, revenue growth doesn't amount to much if the business can't scale well. Unless the balance sheet is strong, the company might have to raise capital.
The image below shows how earnings and revenue have tracked over time (if you click on the image you can see greater detail).
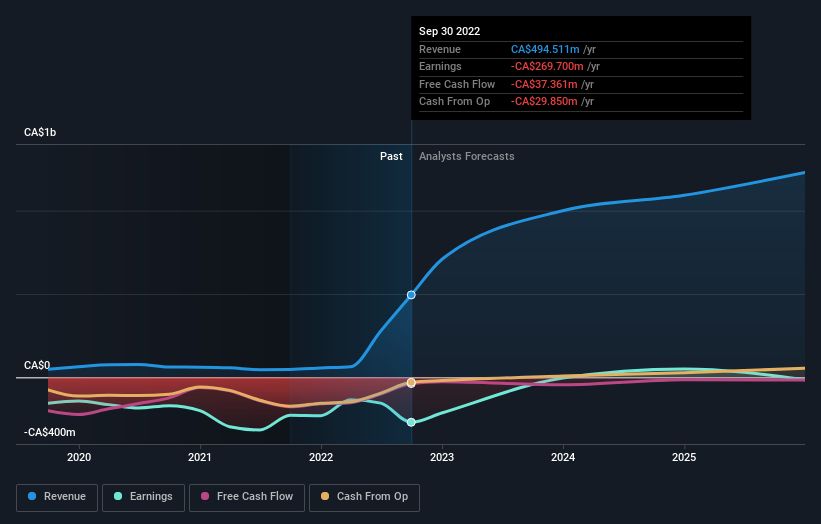
Balance sheet strength is crucial. It might be well worthwhile taking a look at our free report on how its financial position has changed over time.
A Different Perspective
SNDL shareholders are down 47% for the year, falling short of the market return. The market shed around 6.9%, no doubt weighing on the stock price. The three-year loss of 23% per year isn't as bad as the last twelve months, suggesting that the company has not been able to convince the market it has solved its problems. We would be wary of buying into a company with unsolved problems, although some investors will buy into struggling stocks if they believe the price is sufficiently attractive. While it is well worth considering the different impacts that market conditions can have on the share price, there are other factors that are even more important. Take risks, for example - SNDL has 1 warning sign we think you should be aware of.
We will like SNDL better if we see some big insider buys. While we wait, check out this free list of growing companies with considerable, recent, insider buying.
Please note, the market returns quoted in this article reflect the market weighted average returns of stocks that currently trade on US exchanges.
Have feedback on this article? Concerned about the content? Get in touch with us directly. Alternatively, email editorial-team (at) simplywallst.com.
This article by Simply Wall St is general in nature. We provide commentary based on historical data and analyst forecasts only using an unbiased methodology and our articles are not intended to be financial advice. It does not constitute a recommendation to buy or sell any stock, and does not take account of your objectives, or your financial situation. We aim to bring you long-term focused analysis driven by fundamental data. Note that our analysis may not factor in the latest price-sensitive company announcements or qualitative material. Simply Wall St has no position in any stocks mentioned.
Join A Paid User Research Session
You’ll receive a US$30 Amazon Gift card for 1 hour of your time while helping us build better investing tools for the individual investors like yourself. Sign up here
