
 Yahoo Finance
 Investors Shouldn't Overlook SIR Royalty Income Fund's (TSE:SRV.UN) Impressive Returns On Capital
Finding a business that has the potential to grow substantially is not easy, but it is possible if we look at a few key financial metrics. Firstly, we'll want to see a proven return on capital employed (ROCE) that is increasing, and secondly, an expanding base of capital employed. Basically this means that a company has profitable initiatives that it can continue to reinvest in, which is a trait of a compounding machine. And in light of that, the trends we're seeing at SIR Royalty Income Fund's (TSE:SRV.UN) look very promising so lets take a look.
Return On Capital Employed (ROCE): What Is It?
For those who don't know, ROCE is a measure of a company's yearly pre-tax profit (its return), relative to the capital employed in the business. Analysts use this formula to calculate it for SIR Royalty Income Fund:
Return on Capital Employed = Earnings Before Interest and Tax (EBIT) ÷ (Total Assets - Current Liabilities)
0.20 = CA$8.8m ÷ (CA$47m - CA$4.1m) (Based on the trailing twelve months to March 2022).
So, SIR Royalty Income Fund has an ROCE of 20%. That's a fantastic return and not only that, it outpaces the average of 8.9% earned by companies in a similar industry.
View our latest analysis for SIR Royalty Income Fund
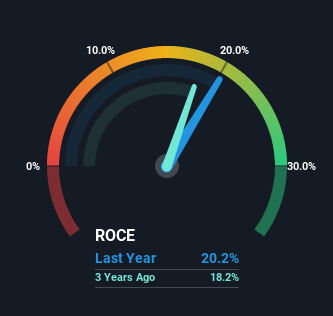
While the past is not representative of the future, it can be helpful to know how a company has performed historically, which is why we have this chart above. If you'd like to look at how SIR Royalty Income Fund has performed in the past in other metrics, you can view this free graph of past earnings, revenue and cash flow.
What The Trend Of ROCE Can Tell Us
We're pretty happy with how the ROCE has been trending at SIR Royalty Income Fund. We found that the returns on capital employed over the last five years have risen by 46%. That's not bad because this tells for every dollar invested (capital employed), the company is increasing the amount earned from that dollar. In regards to capital employed, SIR Royalty Income Fund appears to been achieving more with less, since the business is using 53% less capital to run its operation. SIR Royalty Income Fund may be selling some assets so it's worth investigating if the business has plans for future investments to increase returns further still.
The Key Takeaway
In the end, SIR Royalty Income Fund has proven it's capital allocation skills are good with those higher returns from less amount of capital. Since the stock has only returned 36% to shareholders over the last five years, the promising fundamentals may not be recognized yet by investors. So with that in mind, we think the stock deserves further research.
If you'd like to know about the risks facing SIR Royalty Income Fund, we've discovered 2 warning signs that you should be aware of.
If you'd like to see other companies earning high returns, check out our free list of companies earning high returns with solid balance sheets here.
Have feedback on this article? Concerned about the content? Get in touch with us directly. Alternatively, email editorial-team (at) simplywallst.com.
This article by Simply Wall St is general in nature. We provide commentary based on historical data and analyst forecasts only using an unbiased methodology and our articles are not intended to be financial advice. It does not constitute a recommendation to buy or sell any stock, and does not take account of your objectives, or your financial situation. We aim to bring you long-term focused analysis driven by fundamental data. Note that our analysis may not factor in the latest price-sensitive company announcements or qualitative material. Simply Wall St has no position in any stocks mentioned.
Join A Paid User Research Session
You’ll receive a US$30 Amazon Gift card for 1 hour of your time while helping us build better investing tools for the individual investors like yourself. Sign up here
