
 Yahoo Finance
 Investors Met With Slowing Returns on Capital At CCL Industries (TSE:CCL.B)
If you're not sure where to start when looking for the next multi-bagger, there are a few key trends you should keep an eye out for. In a perfect world, we'd like to see a company investing more capital into its business and ideally the returns earned from that capital are also increasing. If you see this, it typically means it's a company with a great business model and plenty of profitable reinvestment opportunities. So, when we ran our eye over CCL Industries' (TSE:CCL.B) trend of ROCE, we liked what we saw.
Understanding Return On Capital Employed (ROCE)
Just to clarify if you're unsure, ROCE is a metric for evaluating how much pre-tax income (in percentage terms) a company earns on the capital invested in its business. To calculate this metric for CCL Industries, this is the formula:
Return on Capital Employed = Earnings Before Interest and Tax (EBIT) ÷ (Total Assets - Current Liabilities)
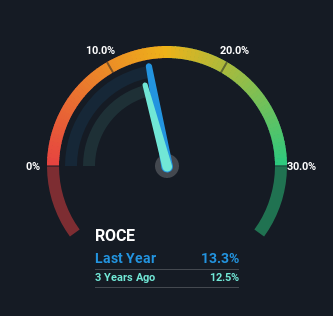
0.13 = CA$825m ÷ (CA$7.6b - CA$1.4b) (Based on the trailing twelve months to December 2021).
So, CCL Industries has an ROCE of 13%. That's a relatively normal return on capital, and it's around the 15% generated by the Packaging industry.
See our latest analysis for CCL Industries
In the above chart we have measured CCL Industries' prior ROCE against its prior performance, but the future is arguably more important. If you're interested, you can view the analysts predictions in our free report on analyst forecasts for the company.
What Does the ROCE Trend For CCL Industries Tell Us?
The trend of ROCE doesn't stand out much, but returns on a whole are decent. The company has employed 64% more capital in the last five years, and the returns on that capital have remained stable at 13%. Since 13% is a moderate ROCE though, it's good to see a business can continue to reinvest at these decent rates of return. Over long periods of time, returns like these might not be too exciting, but with consistency they can pay off in terms of share price returns.
Our Take On CCL Industries' ROCE
The main thing to remember is that CCL Industries has proven its ability to continually reinvest at respectable rates of return. However, over the last five years, the stock has only delivered a 2.3% return to shareholders who held over that period. So because of the trends we're seeing, we'd recommend looking further into this stock to see if it has the makings of a multi-bagger.
If you're still interested in CCL Industries it's worth checking out our FREE intrinsic value approximation to see if it's trading at an attractive price in other respects.
While CCL Industries may not currently earn the highest returns, we've compiled a list of companies that currently earn more than 25% return on equity. Check out this free list here.
Have feedback on this article? Concerned about the content? Get in touch with us directly. Alternatively, email editorial-team (at) simplywallst.com.
This article by Simply Wall St is general in nature. We provide commentary based on historical data and analyst forecasts only using an unbiased methodology and our articles are not intended to be financial advice. It does not constitute a recommendation to buy or sell any stock, and does not take account of your objectives, or your financial situation. We aim to bring you long-term focused analysis driven by fundamental data. Note that our analysis may not factor in the latest price-sensitive company announcements or qualitative material. Simply Wall St has no position in any stocks mentioned.
