
 Yahoo Finance
 Some Investors May Be Worried About Cambium Networks' (NASDAQ:CMBM) Returns On Capital
To find a multi-bagger stock, what are the underlying trends we should look for in a business? One common approach is to try and find a company with returns on capital employed (ROCE) that are increasing, in conjunction with a growing amount of capital employed. This shows us that it's a compounding machine, able to continually reinvest its earnings back into the business and generate higher returns. However, after briefly looking over the numbers, we don't think Cambium Networks (NASDAQ:CMBM) has the makings of a multi-bagger going forward, but let's have a look at why that may be.
Understanding Return On Capital Employed (ROCE)
If you haven't worked with ROCE before, it measures the 'return' (pre-tax profit) a company generates from capital employed in its business. Analysts use this formula to calculate it for Cambium Networks:
Return on Capital Employed = Earnings Before Interest and Tax (EBIT) ÷ (Total Assets - Current Liabilities)
0.08 = US$13m ÷ (US$247m - US$80m) (Based on the trailing twelve months to September 2022).
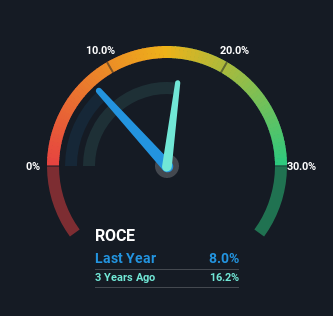
So, Cambium Networks has an ROCE of 8.0%. In absolute terms, that's a low return but it's around the Communications industry average of 9.3%.
See our latest analysis for Cambium Networks
In the above chart we have measured Cambium Networks' prior ROCE against its prior performance, but the future is arguably more important. If you'd like, you can check out the forecasts from the analysts covering Cambium Networks here for free.
How Are Returns Trending?
In terms of Cambium Networks' historical ROCE movements, the trend isn't fantastic. Around five years ago the returns on capital were 21%, but since then they've fallen to 8.0%. Given the business is employing more capital while revenue has slipped, this is a bit concerning. This could mean that the business is losing its competitive advantage or market share, because while more money is being put into ventures, it's actually producing a lower return - "less bang for their buck" per se.
The Bottom Line
From the above analysis, we find it rather worrisome that returns on capital and sales for Cambium Networks have fallen, meanwhile the business is employing more capital than it was five years ago. The market must be rosy on the stock's future because even though the underlying trends aren't too encouraging, the stock has soared 244%. In any case, the current underlying trends don't bode well for long term performance so unless they reverse, we'd start looking elsewhere.
If you'd like to know more about Cambium Networks, we've spotted 3 warning signs, and 1 of them is potentially serious.
While Cambium Networks isn't earning the highest return, check out this free list of companies that are earning high returns on equity with solid balance sheets.
Have feedback on this article? Concerned about the content? Get in touch with us directly. Alternatively, email editorial-team (at) simplywallst.com.
This article by Simply Wall St is general in nature. We provide commentary based on historical data and analyst forecasts only using an unbiased methodology and our articles are not intended to be financial advice. It does not constitute a recommendation to buy or sell any stock, and does not take account of your objectives, or your financial situation. We aim to bring you long-term focused analysis driven by fundamental data. Note that our analysis may not factor in the latest price-sensitive company announcements or qualitative material. Simply Wall St has no position in any stocks mentioned.
Join A Paid User Research Session
You’ll receive a US$30 Amazon Gift card for 1 hour of your time while helping us build better investing tools for the individual investors like yourself. Sign up here
