
 Yahoo Finance
 Investors in Karora Resources (TSE:KRR) have made a strong return of 203% over the past five years
Karora Resources Inc. (TSE:KRR) shareholders have seen the share price descend 16% over the month. But that doesn't change the fact that shareholders have received really good returns over the last five years. We think most investors would be happy with the 203% return, over that period. Generally speaking the long term returns will give you a better idea of business quality than short periods can. Of course, that doesn't necessarily mean it's cheap now.
Now it's worth having a look at the company's fundamentals too, because that will help us determine if the long term shareholder return has matched the performance of the underlying business.
See our latest analysis for Karora Resources
To quote Buffett, 'Ships will sail around the world but the Flat Earth Society will flourish. There will continue to be wide discrepancies between price and value in the marketplace...' One imperfect but simple way to consider how the market perception of a company has shifted is to compare the change in the earnings per share (EPS) with the share price movement.
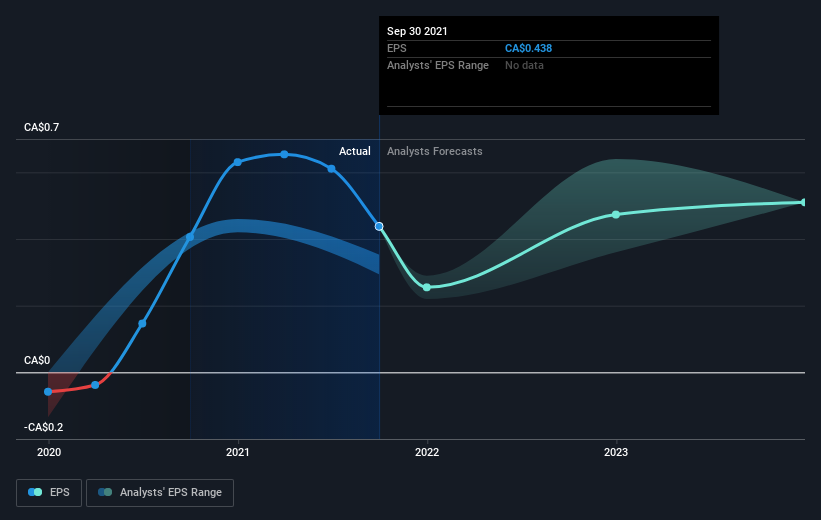
During the last half decade, Karora Resources became profitable. Sometimes, the start of profitability is a major inflection point that can signal fast earnings growth to come, which in turn justifies very strong share price gains.
The image below shows how EPS has tracked over time (if you click on the image you can see greater detail).
It is of course excellent to see how Karora Resources has grown profits over the years, but the future is more important for shareholders. If you are thinking of buying or selling Karora Resources stock, you should check out this FREE detailed report on its balance sheet.
A Different Perspective
Karora Resources provided a TSR of 10% over the last twelve months. Unfortunately this falls short of the market return. If we look back over five years, the returns are even better, coming in at 25% per year for five years. It may well be that this is a business worth popping on the watching, given the continuing positive reception, over time, from the market. It's always interesting to track share price performance over the longer term. But to understand Karora Resources better, we need to consider many other factors. Even so, be aware that Karora Resources is showing 4 warning signs in our investment analysis , and 1 of those makes us a bit uncomfortable...
But note: Karora Resources may not be the best stock to buy. So take a peek at this free list of interesting companies with past earnings growth (and further growth forecast).
Please note, the market returns quoted in this article reflect the market weighted average returns of stocks that currently trade on CA exchanges.
Have feedback on this article? Concerned about the content? Get in touch with us directly. Alternatively, email editorial-team (at) simplywallst.com.
This article by Simply Wall St is general in nature. We provide commentary based on historical data and analyst forecasts only using an unbiased methodology and our articles are not intended to be financial advice. It does not constitute a recommendation to buy or sell any stock, and does not take account of your objectives, or your financial situation. We aim to bring you long-term focused analysis driven by fundamental data. Note that our analysis may not factor in the latest price-sensitive company announcements or qualitative material. Simply Wall St has no position in any stocks mentioned.
