
 Yahoo Finance
 Investors in Kandi Technologies Group (NASDAQ:KNDI) have unfortunately lost 45% over the last year
Passive investing in an index fund is a good way to ensure your own returns roughly match the overall market. When you buy individual stocks, you can make higher profits, but you also face the risk of under-performance. Investors in Kandi Technologies Group, Inc. (NASDAQ:KNDI) have tasted that bitter downside in the last year, as the share price dropped 45%. That's well below the market return of 36%. On the other hand, the stock is actually up 24% over three years.
Since shareholders are down over the longer term, lets look at the underlying fundamentals over the that time and see if they've been consistent with returns.
Check out our latest analysis for Kandi Technologies Group
While the efficient markets hypothesis continues to be taught by some, it has been proven that markets are over-reactive dynamic systems, and investors are not always rational. One imperfect but simple way to consider how the market perception of a company has shifted is to compare the change in the earnings per share (EPS) with the share price movement.
Kandi Technologies Group managed to increase earnings per share from a loss to a profit, over the last 12 months.
Earnings per share growth rates aren't particularly useful for comparing with the share price, when a company has moved from loss to profit. But we may find different metrics more enlightening.
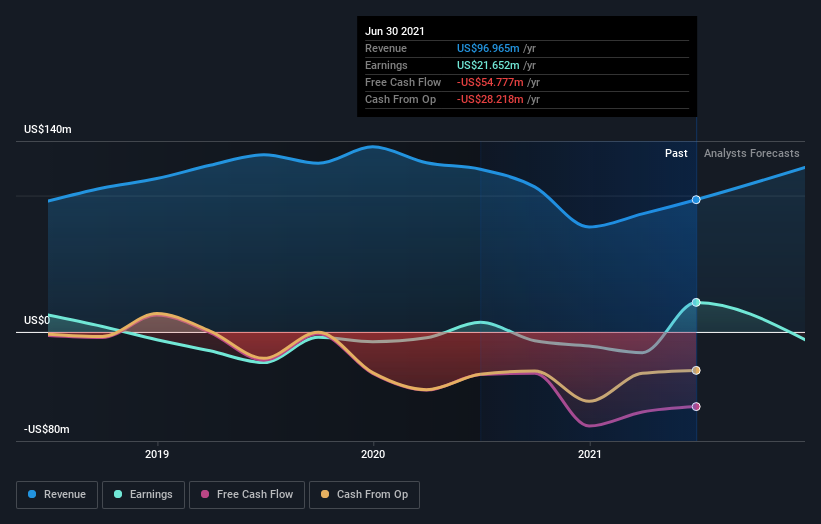
In contrast, the 19% drop in revenue is a real concern. If the market sees the weak revenue as jeopardising EPS, that could explain the lower share price.
You can see below how earnings and revenue have changed over time (discover the exact values by clicking on the image).
It's probably worth noting that the CEO is paid less than the median at similar sized companies. But while CEO remuneration is always worth checking, the really important question is whether the company can grow earnings going forward. So we recommend checking out this free report showing consensus forecasts
A Different Perspective
Investors in Kandi Technologies Group had a tough year, with a total loss of 45%, against a market gain of about 36%. However, keep in mind that even the best stocks will sometimes underperform the market over a twelve month period. Unfortunately, last year's performance may indicate unresolved challenges, given that it was worse than the annualised loss of 4% over the last half decade. We realise that Baron Rothschild has said investors should "buy when there is blood on the streets", but we caution that investors should first be sure they are buying a high quality business. It's always interesting to track share price performance over the longer term. But to understand Kandi Technologies Group better, we need to consider many other factors. To that end, you should learn about the 3 warning signs we've spotted with Kandi Technologies Group (including 1 which is a bit unpleasant) .
Of course Kandi Technologies Group may not be the best stock to buy. So you may wish to see this free collection of growth stocks.
Please note, the market returns quoted in this article reflect the market weighted average returns of stocks that currently trade on US exchanges.
This article by Simply Wall St is general in nature. We provide commentary based on historical data and analyst forecasts only using an unbiased methodology and our articles are not intended to be financial advice. It does not constitute a recommendation to buy or sell any stock, and does not take account of your objectives, or your financial situation. We aim to bring you long-term focused analysis driven by fundamental data. Note that our analysis may not factor in the latest price-sensitive company announcements or qualitative material. Simply Wall St has no position in any stocks mentioned.
Have feedback on this article? Concerned about the content? Get in touch with us directly. Alternatively, email editorial-team (at) simplywallst.com.
