
 Yahoo Finance
 Investors in GrainCorp (ASX:GNC) have made a splendid return of 109% over the past five years
These days it's easy to simply buy an index fund, and your returns should (roughly) match the market. A talented investor can beat the market with a diversified portfolio, but even then, some stocks will under-perform. While the GrainCorp Limited (ASX:GNC) share price is down 12% over half a decade, the total return to shareholders (which includes dividends) was 109%. And that total return actually beats the market return of 38%.
Now let's have a look at the company's fundamentals, and see if the long term shareholder return has matched the performance of the underlying business.
See our latest analysis for GrainCorp
To quote Buffett, 'Ships will sail around the world but the Flat Earth Society will flourish. There will continue to be wide discrepancies between price and value in the marketplace...' One imperfect but simple way to consider how the market perception of a company has shifted is to compare the change in the earnings per share (EPS) with the share price movement.
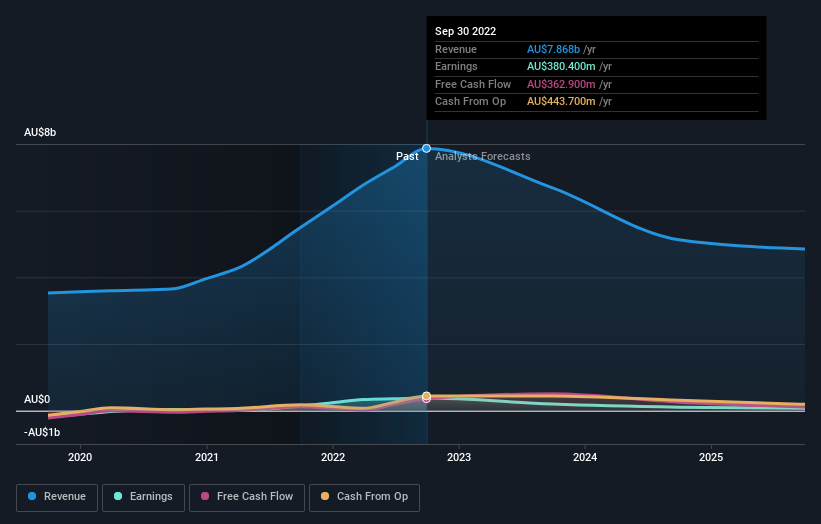
During five years of share price growth, GrainCorp moved from a loss to profitability. Most would consider that to be a good thing, so it's counter-intuitive to see the share price declining. Other metrics may better explain the share price move.
Revenue is actually up 12% over the time period. So it seems one might have to take closer look at the fundamentals to understand why the share price languishes. After all, there may be an opportunity.
The image below shows how earnings and revenue have tracked over time (if you click on the image you can see greater detail).
It's probably worth noting we've seen significant insider buying in the last quarter, which we consider a positive. On the other hand, we think the revenue and earnings trends are much more meaningful measures of the business. So it makes a lot of sense to check out what analysts think GrainCorp will earn in the future (free profit forecasts).
What About Dividends?
When looking at investment returns, it is important to consider the difference between total shareholder return (TSR) and share price return. Whereas the share price return only reflects the change in the share price, the TSR includes the value of dividends (assuming they were reinvested) and the benefit of any discounted capital raising or spin-off. Arguably, the TSR gives a more comprehensive picture of the return generated by a stock. In the case of GrainCorp, it has a TSR of 109% for the last 5 years. That exceeds its share price return that we previously mentioned. This is largely a result of its dividend payments!
A Different Perspective
We regret to report that GrainCorp shareholders are down 4.3% for the year (even including dividends). Unfortunately, that's worse than the broader market decline of 3.3%. Having said that, it's inevitable that some stocks will be oversold in a falling market. The key is to keep your eyes on the fundamental developments. On the bright side, long term shareholders have made money, with a gain of 16% per year over half a decade. It could be that the recent sell-off is an opportunity, so it may be worth checking the fundamental data for signs of a long term growth trend. It's always interesting to track share price performance over the longer term. But to understand GrainCorp better, we need to consider many other factors. To that end, you should learn about the 2 warning signs we've spotted with GrainCorp (including 1 which shouldn't be ignored) .
There are plenty of other companies that have insiders buying up shares. You probably do not want to miss this free list of growing companies that insiders are buying.
Please note, the market returns quoted in this article reflect the market weighted average returns of stocks that currently trade on AU exchanges.
Have feedback on this article? Concerned about the content? Get in touch with us directly. Alternatively, email editorial-team (at) simplywallst.com.
This article by Simply Wall St is general in nature. We provide commentary based on historical data and analyst forecasts only using an unbiased methodology and our articles are not intended to be financial advice. It does not constitute a recommendation to buy or sell any stock, and does not take account of your objectives, or your financial situation. We aim to bring you long-term focused analysis driven by fundamental data. Note that our analysis may not factor in the latest price-sensitive company announcements or qualitative material. Simply Wall St has no position in any stocks mentioned.
Join A Paid User Research Session
You’ll receive a US$30 Amazon Gift card for 1 hour of your time while helping us build better investing tools for the individual investors like yourself. Sign up here
