
 Yahoo Finance
 Investors in A.G. BARR (LON:BAG) have unfortunately lost 22% over the last five years
Ideally, your overall portfolio should beat the market average. But even the best stock picker will only win with some selections. At this point some shareholders may be questioning their investment in A.G. BARR p.l.c. (LON:BAG), since the last five years saw the share price fall 29%. Shareholders have had an even rougher run lately, with the share price down 19% in the last 90 days.
Since shareholders are down over the longer term, lets look at the underlying fundamentals over the that time and see if they've been consistent with returns.
See our latest analysis for A.G. BARR
In his essay The Superinvestors of Graham-and-Doddsville Warren Buffett described how share prices do not always rationally reflect the value of a business. By comparing earnings per share (EPS) and share price changes over time, we can get a feel for how investor attitudes to a company have morphed over time.
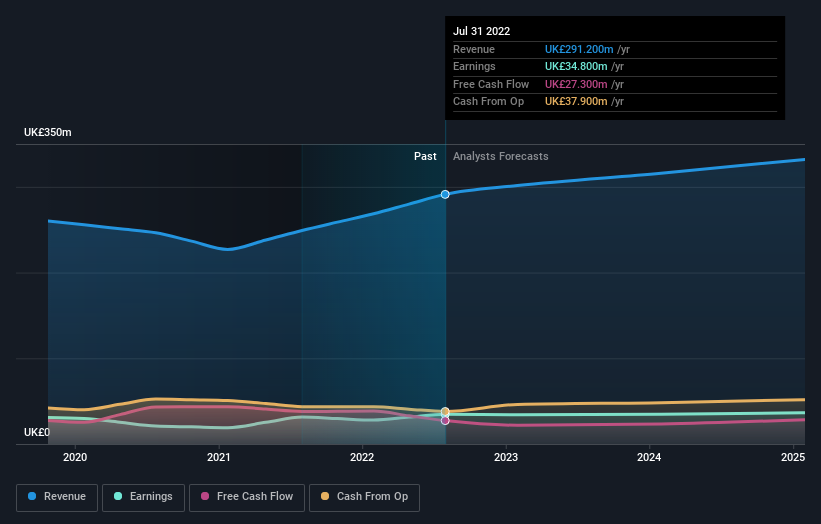
During the unfortunate half decade during which the share price slipped, A.G. BARR actually saw its earnings per share (EPS) improve by 0.9% per year. Given the share price reaction, one might suspect that EPS is not a good guide to the business performance during the period (perhaps due to a one-off loss or gain). Or possibly, the market was previously very optimistic, so the stock has disappointed, despite improving EPS.
Based on these numbers, we'd venture that the market may have been over-optimistic about forecast growth, half a decade ago. Looking to other metrics might better explain the share price change.
The revenue decline of 0.5% isn't too bad. But it's quite possible the market had expected better; a closer look at the revenue trends might explain the pessimism.
The image below shows how earnings and revenue have tracked over time (if you click on the image you can see greater detail).
We know that A.G. BARR has improved its bottom line lately, but what does the future have in store? This free report showing analyst forecasts should help you form a view on A.G. BARR
What About Dividends?
When looking at investment returns, it is important to consider the difference between total shareholder return (TSR) and share price return. The TSR is a return calculation that accounts for the value of cash dividends (assuming that any dividend received was reinvested) and the calculated value of any discounted capital raisings and spin-offs. So for companies that pay a generous dividend, the TSR is often a lot higher than the share price return. We note that for A.G. BARR the TSR over the last 5 years was -22%, which is better than the share price return mentioned above. This is largely a result of its dividend payments!
A Different Perspective
The total return of 9.3% received by A.G. BARR shareholders over the last year isn't far from the market return of -8.8%. Unfortunately, last year's performance is a deterioration of an already poor long term track record, given the loss of 4% per year over the last five years. It will probably take a substantial improvement in the fundamental performance for the company to reverse this trend. I find it very interesting to look at share price over the long term as a proxy for business performance. But to truly gain insight, we need to consider other information, too. For example, we've discovered 1 warning sign for A.G. BARR that you should be aware of before investing here.
We will like A.G. BARR better if we see some big insider buys. While we wait, check out this free list of growing companies with considerable, recent, insider buying.
Please note, the market returns quoted in this article reflect the market weighted average returns of stocks that currently trade on GB exchanges.
Have feedback on this article? Concerned about the content? Get in touch with us directly. Alternatively, email editorial-team (at) simplywallst.com.
This article by Simply Wall St is general in nature. We provide commentary based on historical data and analyst forecasts only using an unbiased methodology and our articles are not intended to be financial advice. It does not constitute a recommendation to buy or sell any stock, and does not take account of your objectives, or your financial situation. We aim to bring you long-term focused analysis driven by fundamental data. Note that our analysis may not factor in the latest price-sensitive company announcements or qualitative material. Simply Wall St has no position in any stocks mentioned.
Join A Paid User Research Session
You’ll receive a US$30 Amazon Gift card for 1 hour of your time while helping us build better investing tools for the individual investors like yourself. Sign up here
