
 Yahoo Finance
 How Should Investors Feel About Qualys, Inc.’s (NASDAQ:QLYS) CEO Pay?

Want to participate in a short research study? Help shape the future of investing tools and receive a $20 prize!
Philippe Courtot became the CEO of Qualys, Inc. (NASDAQ:QLYS) in 2001. This analysis aims first to contrast CEO compensation with other companies that have similar market capitalization. Next, we’ll consider growth that the business demonstrates. And finally – as a second measure of performance – we will look at the returns shareholders have received over the last few years. The aim of all this is to consider the appropriateness of CEO pay levels.
Check out our latest analysis for Qualys
How Does Philippe Courtot’s Compensation Compare With Similar Sized Companies?
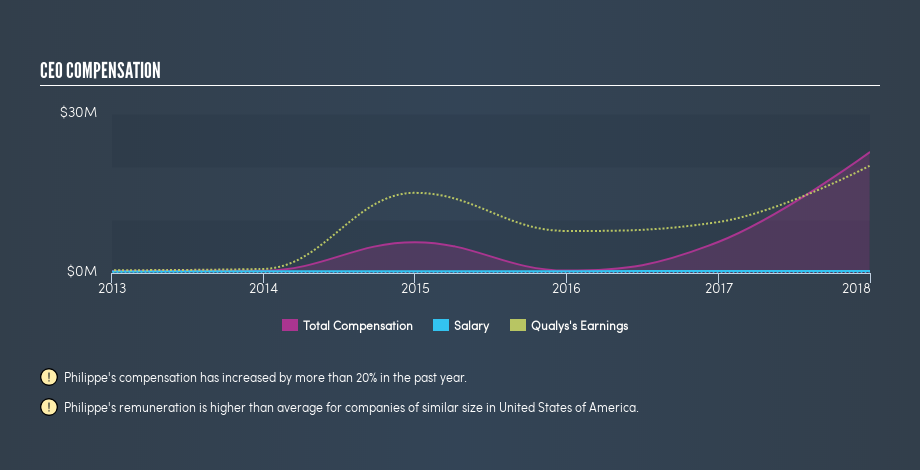
Our data indicates that Qualys, Inc. is worth US$3.2b, and total annual CEO compensation is US$23m. (This figure is for the year to 2017). We think total compensation is more important but we note that the CEO salary is lower, at US$375k. We examined companies with market caps from US$2.0b to US$6.4b, and discovered that the median CEO compensation of that group was US$4.7m.
It would therefore appear that Qualys, Inc. pays Philippe Courtot more than the median CEO remuneration at companies of a similar size, in the same market. However, this fact alone doesn’t mean the remuneration is too high. We can better assess whether the pay is overly generous by looking into the underlying business performance.
The graphic below shows how CEO compensation at Qualys has changed from year to year.
Is Qualys, Inc. Growing?
On average over the last three years, Qualys, Inc. has grown earnings per share (EPS) by 32% each year (using a line of best fit). In the last year, its revenue is up 21%.
This shows that the company has improved itself over the last few years. Good news for shareholders. This sort of respectable year-on-year revenue growth is often seen at a healthy, growing business. You might want to check this free visual report on analyst forecasts for future earnings.
Has Qualys, Inc. Been A Good Investment?
Boasting a total shareholder return of 246% over three years, Qualys, Inc. has done well by shareholders. As a result, some may believe the CEO should be paid more than is normal for companies of similar size.
In Summary…
We compared the total CEO remuneration paid by Qualys, Inc., and compared it to remuneration at a group of similar sized companies. Our data suggests that it pays above the median CEO pay within that group.
However, the earnings per share growth over three years is certainly impressive. On top of that, in the same period, returns to shareholders have been great. Considering this fine result for shareholders, we daresay the CEO compensation might be apt. If you think CEO compensation levels are interesting you will probably really like this free visualization of insider trading at Qualys.
Arguably, business quality is much more important than CEO compensation levels. So check out this free list of interesting companies, that have HIGH return on equity and low debt.
We aim to bring you long-term focused research analysis driven by fundamental data. Note that our analysis may not factor in the latest price-sensitive company announcements or qualitative material.
If you spot an error that warrants correction, please contact the editor at editorial-team@simplywallst.com. This article by Simply Wall St is general in nature. It does not constitute a recommendation to buy or sell any stock, and does not take account of your objectives, or your financial situation. Simply Wall St has no position in the stocks mentioned. On rare occasion, data errors may occur. Thank you for reading.
