
 Yahoo Finance
 Investors Should Be Encouraged By Morgan Sindall Group's (LON:MGNS) Returns On Capital
If we want to find a stock that could multiply over the long term, what are the underlying trends we should look for? One common approach is to try and find a company with returns on capital employed (ROCE) that are increasing, in conjunction with a growing amount of capital employed. This shows us that it's a compounding machine, able to continually reinvest its earnings back into the business and generate higher returns. Speaking of which, we noticed some great changes in Morgan Sindall Group's (LON:MGNS) returns on capital, so let's have a look.
Return On Capital Employed (ROCE): What Is It?
If you haven't worked with ROCE before, it measures the 'return' (pre-tax profit) a company generates from capital employed in its business. Analysts use this formula to calculate it for Morgan Sindall Group:
Return on Capital Employed = Earnings Before Interest and Tax (EBIT) ÷ (Total Assets - Current Liabilities)
0.22 = UK£129m ÷ (UK£1.7b - UK£1.1b) (Based on the trailing twelve months to June 2022).
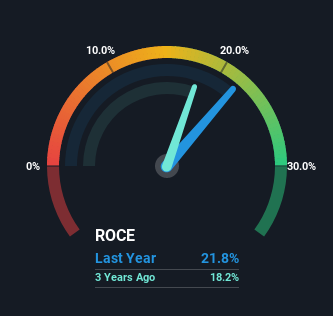
Thus, Morgan Sindall Group has an ROCE of 22%. In absolute terms that's a great return and it's even better than the Construction industry average of 8.9%.
Check out our latest analysis for Morgan Sindall Group
Above you can see how the current ROCE for Morgan Sindall Group compares to its prior returns on capital, but there's only so much you can tell from the past. If you're interested, you can view the analysts predictions in our free report on analyst forecasts for the company.
What Does the ROCE Trend For Morgan Sindall Group Tell Us?
Investors would be pleased with what's happening at Morgan Sindall Group. Over the last five years, returns on capital employed have risen substantially to 22%. The amount of capital employed has increased too, by 84%. So we're very much inspired by what we're seeing at Morgan Sindall Group thanks to its ability to profitably reinvest capital.
On a separate but related note, it's important to know that Morgan Sindall Group has a current liabilities to total assets ratio of 64%, which we'd consider pretty high. This effectively means that suppliers (or short-term creditors) are funding a large portion of the business, so just be aware that this can introduce some elements of risk. While it's not necessarily a bad thing, it can be beneficial if this ratio is lower.
The Bottom Line
In summary, it's great to see that Morgan Sindall Group can compound returns by consistently reinvesting capital at increasing rates of return, because these are some of the key ingredients of those highly sought after multi-baggers. Investors may not be impressed by the favorable underlying trends yet because over the last five years the stock has only returned 28% to shareholders. Given that, we'd look further into this stock in case it has more traits that could make it multiply in the long term.
If you'd like to know more about Morgan Sindall Group, we've spotted 2 warning signs, and 1 of them doesn't sit too well with us.
If you'd like to see other companies earning high returns, check out our free list of companies earning high returns with solid balance sheets here.
Have feedback on this article? Concerned about the content? Get in touch with us directly. Alternatively, email editorial-team (at) simplywallst.com.
This article by Simply Wall St is general in nature. We provide commentary based on historical data and analyst forecasts only using an unbiased methodology and our articles are not intended to be financial advice. It does not constitute a recommendation to buy or sell any stock, and does not take account of your objectives, or your financial situation. We aim to bring you long-term focused analysis driven by fundamental data. Note that our analysis may not factor in the latest price-sensitive company announcements or qualitative material. Simply Wall St has no position in any stocks mentioned.
Join A Paid User Research Session
You’ll receive a US$30 Amazon Gift card for 1 hour of your time while helping us build better investing tools for the individual investors like yourself. Sign up here
