
 Yahoo Finance
 Investors Should Be Encouraged By Cross Country Healthcare's (NASDAQ:CCRN) Returns On Capital
If we want to find a potential multi-bagger, often there are underlying trends that can provide clues. Firstly, we'll want to see a proven return on capital employed (ROCE) that is increasing, and secondly, an expanding base of capital employed. This shows us that it's a compounding machine, able to continually reinvest its earnings back into the business and generate higher returns. And in light of that, the trends we're seeing at Cross Country Healthcare's (NASDAQ:CCRN) look very promising so lets take a look.
Understanding Return On Capital Employed (ROCE)
For those that aren't sure what ROCE is, it measures the amount of pre-tax profits a company can generate from the capital employed in its business. To calculate this metric for Cross Country Healthcare, this is the formula:
Return on Capital Employed = Earnings Before Interest and Tax (EBIT) ÷ (Total Assets - Current Liabilities)
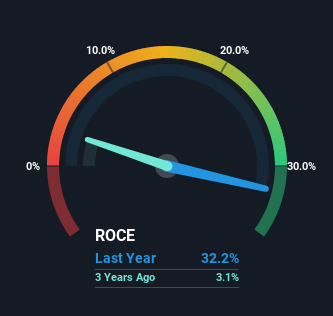
0.32 = US$216m ÷ (US$939m - US$269m) (Based on the trailing twelve months to June 2022).
Therefore, Cross Country Healthcare has an ROCE of 32%. In absolute terms that's a great return and it's even better than the Healthcare industry average of 10.0%.
View our latest analysis for Cross Country Healthcare
Above you can see how the current ROCE for Cross Country Healthcare compares to its prior returns on capital, but there's only so much you can tell from the past. If you're interested, you can view the analysts predictions in our free report on analyst forecasts for the company.
What Can We Tell From Cross Country Healthcare's ROCE Trend?
Investors would be pleased with what's happening at Cross Country Healthcare. The numbers show that in the last five years, the returns generated on capital employed have grown considerably to 32%. The amount of capital employed has increased too, by 128%. So we're very much inspired by what we're seeing at Cross Country Healthcare thanks to its ability to profitably reinvest capital.
In Conclusion...
To sum it up, Cross Country Healthcare has proven it can reinvest in the business and generate higher returns on that capital employed, which is terrific. Since the stock has returned a solid 85% to shareholders over the last five years, it's fair to say investors are beginning to recognize these changes. In light of that, we think it's worth looking further into this stock because if Cross Country Healthcare can keep these trends up, it could have a bright future ahead.
If you'd like to know about the risks facing Cross Country Healthcare, we've discovered 3 warning signs that you should be aware of.
Cross Country Healthcare is not the only stock earning high returns. If you'd like to see more, check out our free list of companies earning high returns on equity with solid fundamentals.
Have feedback on this article? Concerned about the content? Get in touch with us directly. Alternatively, email editorial-team (at) simplywallst.com.
This article by Simply Wall St is general in nature. We provide commentary based on historical data and analyst forecasts only using an unbiased methodology and our articles are not intended to be financial advice. It does not constitute a recommendation to buy or sell any stock, and does not take account of your objectives, or your financial situation. We aim to bring you long-term focused analysis driven by fundamental data. Note that our analysis may not factor in the latest price-sensitive company announcements or qualitative material. Simply Wall St has no position in any stocks mentioned.
Join A Paid User Research Session
You’ll receive a US$30 Amazon Gift card for 1 hour of your time while helping us build better investing tools for the individual investors like yourself. Sign up here
