
 Yahoo Finance
 Investors Could Be Concerned With Fresenius SE KGaA's (ETR:FRE) Returns On Capital
Finding a business that has the potential to grow substantially is not easy, but it is possible if we look at a few key financial metrics. Firstly, we'd want to identify a growing return on capital employed (ROCE) and then alongside that, an ever-increasing base of capital employed. This shows us that it's a compounding machine, able to continually reinvest its earnings back into the business and generate higher returns. However, after briefly looking over the numbers, we don't think Fresenius SE KGaA (ETR:FRE) has the makings of a multi-bagger going forward, but let's have a look at why that may be.
Understanding Return On Capital Employed (ROCE)
For those that aren't sure what ROCE is, it measures the amount of pre-tax profits a company can generate from the capital employed in its business. The formula for this calculation on Fresenius SE KGaA is:
Return on Capital Employed = Earnings Before Interest and Tax (EBIT) ÷ (Total Assets - Current Liabilities)
0.054 = €3.4b ÷ (€76b - €14b) (Based on the trailing twelve months to December 2022).
Thus, Fresenius SE KGaA has an ROCE of 5.4%. In absolute terms, that's a low return but it's around the Healthcare industry average of 5.9%.
See our latest analysis for Fresenius SE KGaA
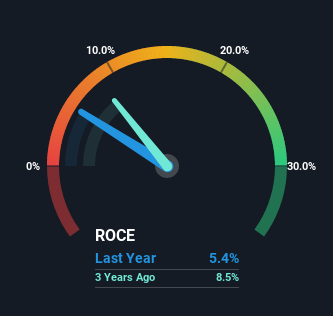
Above you can see how the current ROCE for Fresenius SE KGaA compares to its prior returns on capital, but there's only so much you can tell from the past. If you'd like to see what analysts are forecasting going forward, you should check out our free report for Fresenius SE KGaA.
The Trend Of ROCE
On the surface, the trend of ROCE at Fresenius SE KGaA doesn't inspire confidence. To be more specific, ROCE has fallen from 11% over the last five years. However it looks like Fresenius SE KGaA might be reinvesting for long term growth because while capital employed has increased, the company's sales haven't changed much in the last 12 months. It's worth keeping an eye on the company's earnings from here on to see if these investments do end up contributing to the bottom line.
What We Can Learn From Fresenius SE KGaA's ROCE
In summary, Fresenius SE KGaA is reinvesting funds back into the business for growth but unfortunately it looks like sales haven't increased much just yet. Since the stock has declined 58% over the last five years, investors may not be too optimistic on this trend improving either. In any case, the stock doesn't have these traits of a multi-bagger discussed above, so if that's what you're looking for, we think you'd have more luck elsewhere.
One more thing: We've identified 2 warning signs with Fresenius SE KGaA (at least 1 which shouldn't be ignored) , and understanding these would certainly be useful.
For those who like to invest in solid companies, check out this free list of companies with solid balance sheets and high returns on equity.
Have feedback on this article? Concerned about the content? Get in touch with us directly. Alternatively, email editorial-team (at) simplywallst.com.
This article by Simply Wall St is general in nature. We provide commentary based on historical data and analyst forecasts only using an unbiased methodology and our articles are not intended to be financial advice. It does not constitute a recommendation to buy or sell any stock, and does not take account of your objectives, or your financial situation. We aim to bring you long-term focused analysis driven by fundamental data. Note that our analysis may not factor in the latest price-sensitive company announcements or qualitative material. Simply Wall St has no position in any stocks mentioned.
Join A Paid User Research Session
You’ll receive a US$30 Amazon Gift card for 1 hour of your time while helping us build better investing tools for the individual investors like yourself. Sign up here
