
 Yahoo Finance
 Investors Who Bought Ternium (NYSE:TX) Shares A Year Ago Are Now Up 227%
Unfortunately, investing is risky - companies can and do go bankrupt. But when you pick a company that is really flourishing, you can make more than 100%. For example, the Ternium S.A. (NYSE:TX) share price had more than doubled in just one year - up 227%. It's also up 32% in about a month. It is also impressive that the stock is up 32% over three years, adding to the sense that it is a real winner.
See our latest analysis for Ternium
While the efficient markets hypothesis continues to be taught by some, it has been proven that markets are over-reactive dynamic systems, and investors are not always rational. By comparing earnings per share (EPS) and share price changes over time, we can get a feel for how investor attitudes to a company have morphed over time.
During the last year Ternium grew its earnings per share (EPS) by 316%. This EPS growth is significantly higher than the 227% increase in the share price. Therefore, it seems the market isn't as excited about Ternium as it was before. This could be an opportunity. This cautious sentiment is reflected in its (fairly low) P/E ratio of 6.77.
The company's earnings per share (over time) is depicted in the image below (click to see the exact numbers).
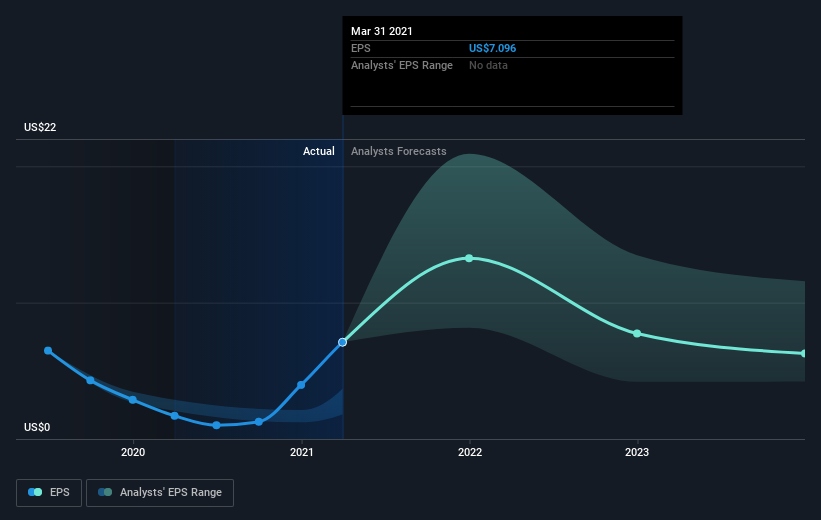
We know that Ternium has improved its bottom line lately, but is it going to grow revenue? If you're interested, you could check this free report showing consensus revenue forecasts.
What About Dividends?
When looking at investment returns, it is important to consider the difference between total shareholder return (TSR) and share price return. Whereas the share price return only reflects the change in the share price, the TSR includes the value of dividends (assuming they were reinvested) and the benefit of any discounted capital raising or spin-off. Arguably, the TSR gives a more comprehensive picture of the return generated by a stock. In the case of Ternium, it has a TSR of 246% for the last year. That exceeds its share price return that we previously mentioned. The dividends paid by the company have thusly boosted the total shareholder return.
A Different Perspective
It's nice to see that Ternium shareholders have received a total shareholder return of 246% over the last year. And that does include the dividend. That's better than the annualised return of 22% over half a decade, implying that the company is doing better recently. In the best case scenario, this may hint at some real business momentum, implying that now could be a great time to delve deeper. I find it very interesting to look at share price over the long term as a proxy for business performance. But to truly gain insight, we need to consider other information, too. Case in point: We've spotted 3 warning signs for Ternium you should be aware of, and 1 of them is potentially serious.
If you would prefer to check out another company -- one with potentially superior financials -- then do not miss this free list of companies that have proven they can grow earnings.
Please note, the market returns quoted in this article reflect the market weighted average returns of stocks that currently trade on US exchanges.
This article by Simply Wall St is general in nature. It does not constitute a recommendation to buy or sell any stock, and does not take account of your objectives, or your financial situation. We aim to bring you long-term focused analysis driven by fundamental data. Note that our analysis may not factor in the latest price-sensitive company announcements or qualitative material. Simply Wall St has no position in any stocks mentioned.
Have feedback on this article? Concerned about the content? Get in touch with us directly. Alternatively, email editorial-team (at) simplywallst.com.
