
 Yahoo Finance
 Investors Who Bought TE Connectivity (NYSE:TEL) Shares A Year Ago Are Now Down 13%

TE Connectivity Ltd. (NYSE:TEL) shareholders should be happy to see the share price up 10% in the last week. But that doesn't change the reality of under-performance over the last twelve months. In fact the stock is down 13% in the last year, well below the market return.
View our latest analysis for TE Connectivity
While the efficient markets hypothesis continues to be taught by some, it has been proven that markets are over-reactive dynamic systems, and investors are not always rational. One way to examine how market sentiment has changed over time is to look at the interaction between a company's share price and its earnings per share (EPS).
Unhappily, TE Connectivity had to report a 75% decline in EPS over the last year. This fall in the EPS is significantly worse than the 13% the share price fall. So despite the weak per-share profits, some investors are probably relieved the situation wasn't more difficult.
The image below shows how EPS has tracked over time (if you click on the image you can see greater detail).
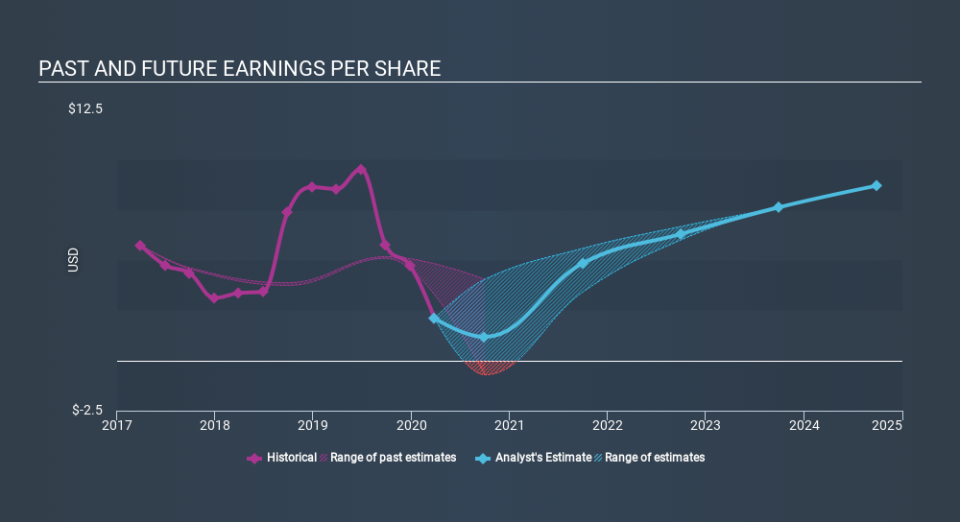
Dive deeper into TE Connectivity's key metrics by checking this interactive graph of TE Connectivity's earnings, revenue and cash flow.
What about the Total Shareholder Return (TSR)?
Investors should note that there's a difference between TE Connectivity's total shareholder return (TSR) and its share price change, which we've covered above. The TSR is a return calculation that accounts for the value of cash dividends (assuming that any dividend received was reinvested) and the calculated value of any discounted capital raisings and spin-offs. TE Connectivity's TSR of was a loss of 11% for the year. That wasn't as bad as its share price return, because it has paid dividends.
A Different Perspective
While the broader market gained around 2.8% in the last year, TE Connectivity shareholders lost 11% (even including dividends) . However, keep in mind that even the best stocks will sometimes underperform the market over a twelve month period. Longer term investors wouldn't be so upset, since they would have made 3.8%, each year, over five years. It could be that the recent sell-off is an opportunity, so it may be worth checking the fundamental data for signs of a long term growth trend. While it is well worth considering the different impacts that market conditions can have on the share price, there are other factors that are even more important. Take risks, for example - TE Connectivity has 5 warning signs we think you should be aware of.
If you are like me, then you will not want to miss this free list of growing companies that insiders are buying.
Please note, the market returns quoted in this article reflect the market weighted average returns of stocks that currently trade on US exchanges.
If you spot an error that warrants correction, please contact the editor at editorial-team@simplywallst.com. This article by Simply Wall St is general in nature. It does not constitute a recommendation to buy or sell any stock, and does not take account of your objectives, or your financial situation. Simply Wall St has no position in the stocks mentioned.
We aim to bring you long-term focused research analysis driven by fundamental data. Note that our analysis may not factor in the latest price-sensitive company announcements or qualitative material. Thank you for reading.
