
 Yahoo Finance
 Investors Who Bought Smart Sand (NASDAQ:SND) Shares Three Years Ago Are Now Down 88%

As an investor, mistakes are inevitable. But really big losses can really drag down an overall portfolio. So spare a thought for the long term shareholders of Smart Sand, Inc. (NASDAQ:SND); the share price is down a whopping 88% in the last three years. That'd be enough to cause even the strongest minds some disquiet. Unfortunately the share price momentum is still quite negative, with prices down 17% in thirty days.
We really hope anyone holding through that price crash has a diversified portfolio. Even when you lose money, you don't have to lose the lesson.
Check out our latest analysis for Smart Sand
While the efficient markets hypothesis continues to be taught by some, it has been proven that markets are over-reactive dynamic systems, and investors are not always rational. One flawed but reasonable way to assess how sentiment around a company has changed is to compare the earnings per share (EPS) with the share price.
Although the share price is down over three years, Smart Sand actually managed to grow EPS by 307% per year in that time. This is quite a puzzle, and suggests there might be something temporarily buoying the share price. Alternatively, growth expectations may have been unreasonable in the past.
It's worth taking a look at other metrics, because the EPS growth doesn't seem to match with the falling share price.
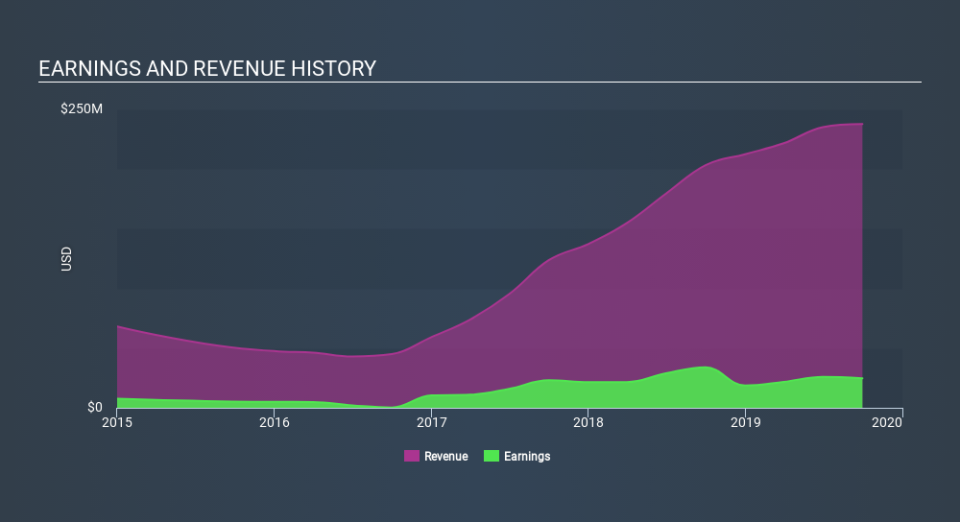
Revenue is actually up 46% over the three years, so the share price drop doesn't seem to hinge on revenue, either. It's probably worth investigating Smart Sand further; while we may be missing something on this analysis, there might also be an opportunity.
You can see how earnings and revenue have changed over time in the image below (click on the chart to see the exact values).
It is of course excellent to see how Smart Sand has grown profits over the years, but the future is more important for shareholders. It might be well worthwhile taking a look at our free report on how its financial position has changed over time.
A Different Perspective
Over the last year, Smart Sand shareholders took a loss of 19%. In contrast the market gained about 24%. Of course the long term matters more than the short term, and even great stocks will sometimes have a poor year. However, the loss over the last year isn't as bad as the 51% per annum loss investors have suffered over the last three years. We'd need clear signs of growth in the underlying business before we could muster much enthusiasm for this one. I find it very interesting to look at share price over the long term as a proxy for business performance. But to truly gain insight, we need to consider other information, too. For example, we've discovered 5 warning signs for Smart Sand (1 is significant!) that you should be aware of before investing here.
If you are like me, then you will not want to miss this free list of growing companies that insiders are buying.
Please note, the market returns quoted in this article reflect the market weighted average returns of stocks that currently trade on US exchanges.
If you spot an error that warrants correction, please contact the editor at editorial-team@simplywallst.com. This article by Simply Wall St is general in nature. It does not constitute a recommendation to buy or sell any stock, and does not take account of your objectives, or your financial situation. Simply Wall St has no position in the stocks mentioned.
We aim to bring you long-term focused research analysis driven by fundamental data. Note that our analysis may not factor in the latest price-sensitive company announcements or qualitative material. Thank you for reading.
