
 Yahoo Finance
 Investors Who Bought Cosan (NYSE:CZZ) Shares Three Years Ago Are Now Up 149%

Want to participate in a short research study? Help shape the future of investing tools and you could win a $250 gift card!
The worst result, after buying shares in a company (assuming no leverage), would be if you lose all the money you put in. But when you pick a company that is really flourishing, you can make more than 100%. For example, the Cosan Limited (NYSE:CZZ) share price has soared 149% in the last three years. That sort of return is as solid as granite. It's also good to see the share price up 10% over the last quarter. But this could be related to the strong market, which is up 7.3% in the last three months.
Check out our latest analysis for Cosan
While the efficient markets hypothesis continues to be taught by some, it has been proven that markets are over-reactive dynamic systems, and investors are not always rational. One imperfect but simple way to consider how the market perception of a company has shifted is to compare the change in the earnings per share (EPS) with the share price movement.
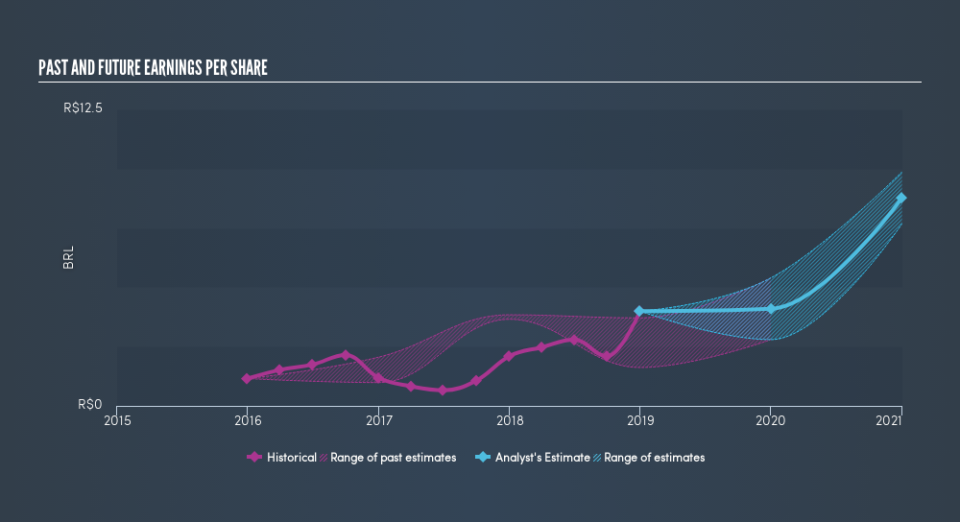
Cosan was able to grow its EPS at 51% per year over three years, sending the share price higher. This EPS growth is higher than the 36% average annual increase in the share price. So it seems investors have become more cautious about the company, over time.
The company's earnings per share (over time) is depicted in the image below (click to see the exact numbers).
It is of course excellent to see how Cosan has grown profits over the years, but the future is more important for shareholders. Take a more thorough look at Cosan's financial health with this free report on its balance sheet.
What About Dividends?
As well as measuring the share price return, investors should also consider the total shareholder return (TSR). Whereas the share price return only reflects the change in the share price, the TSR includes the value of dividends (assuming they were reinvested) and the benefit of any discounted capital raising or spin-off. It's fair to say that the TSR gives a more complete picture for stocks that pay a dividend. We note that for Cosan the TSR over the last 3 years was 158%, which is better than the share price return mentioned above. This is largely a result of its dividend payments!
A Different Perspective
It's nice to see that Cosan shareholders have received a total shareholder return of 27% over the last year. And that does include the dividend. That's better than the annualised return of 1.8% over half a decade, implying that the company is doing better recently. Someone with an optimistic perspective could view the recent improvement in TSR as indicating that the business itself is getting better with time. Is Cosan cheap compared to other companies? These 3 valuation measures might help you decide.
If you would prefer to check out another company -- one with potentially superior financials -- then do not miss this free list of companies that have proven they can grow earnings.
Please note, the market returns quoted in this article reflect the market weighted average returns of stocks that currently trade on US exchanges.
We aim to bring you long-term focused research analysis driven by fundamental data. Note that our analysis may not factor in the latest price-sensitive company announcements or qualitative material.
If you spot an error that warrants correction, please contact the editor at editorial-team@simplywallst.com. This article by Simply Wall St is general in nature. It does not constitute a recommendation to buy or sell any stock, and does not take account of your objectives, or your financial situation. Simply Wall St has no position in the stocks mentioned. Thank you for reading.
