
 Yahoo Finance
 Investors Who Bought Accent Group (ASX:AX1) Shares A Year Ago Are Now Up 104%
Unfortunately, investing is risky - companies can and do go bankrupt. On the other hand, if you find a high quality business to buy (at the right price) you can more than double your money! For example, the Accent Group Limited (ASX:AX1) share price has soared 104% return in just a single year. Also pleasing for shareholders was the 15% gain in the last three months. But this could be related to the strong market, which is up 8.8% in the last three months. Looking back further, the stock price is 73% higher than it was three years ago.
See our latest analysis for Accent Group
While markets are a powerful pricing mechanism, share prices reflect investor sentiment, not just underlying business performance. One way to examine how market sentiment has changed over time is to look at the interaction between a company's share price and its earnings per share (EPS).
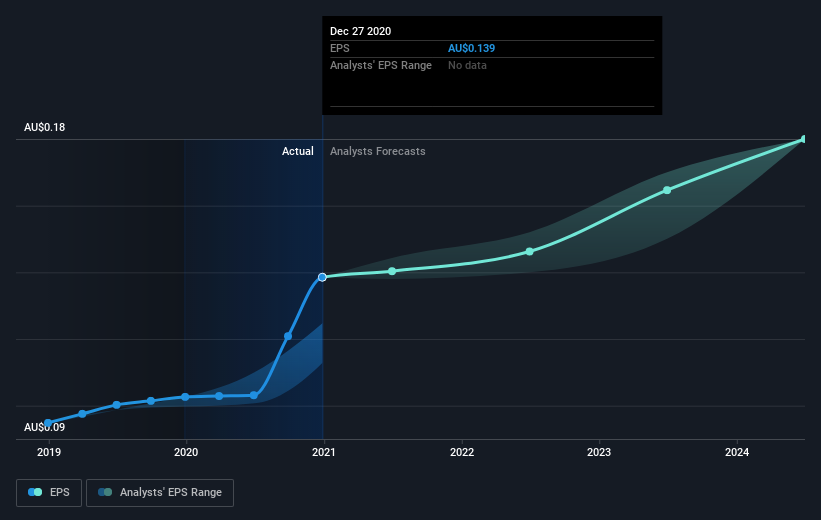
During the last year Accent Group grew its earnings per share (EPS) by 35%. The share price gain of 104% certainly outpaced the EPS growth. This indicates that the market is now more optimistic about the stock.
You can see how EPS has changed over time in the image below (click on the chart to see the exact values).
It is of course excellent to see how Accent Group has grown profits over the years, but the future is more important for shareholders. You can see how its balance sheet has strengthened (or weakened) over time in this free interactive graphic.
What About Dividends?
As well as measuring the share price return, investors should also consider the total shareholder return (TSR). The TSR incorporates the value of any spin-offs or discounted capital raisings, along with any dividends, based on the assumption that the dividends are reinvested. It's fair to say that the TSR gives a more complete picture for stocks that pay a dividend. As it happens, Accent Group's TSR for the last year was 117%, which exceeds the share price return mentioned earlier. The dividends paid by the company have thusly boosted the total shareholder return.
A Different Perspective
It's good to see that Accent Group has rewarded shareholders with a total shareholder return of 117% in the last twelve months. And that does include the dividend. That's better than the annualised return of 21% over half a decade, implying that the company is doing better recently. Given the share price momentum remains strong, it might be worth taking a closer look at the stock, lest you miss an opportunity. I find it very interesting to look at share price over the long term as a proxy for business performance. But to truly gain insight, we need to consider other information, too. For example, we've discovered 2 warning signs for Accent Group that you should be aware of before investing here.
If you would prefer to check out another company -- one with potentially superior financials -- then do not miss this free list of companies that have proven they can grow earnings.
Please note, the market returns quoted in this article reflect the market weighted average returns of stocks that currently trade on AU exchanges.
This article by Simply Wall St is general in nature. It does not constitute a recommendation to buy or sell any stock, and does not take account of your objectives, or your financial situation. We aim to bring you long-term focused analysis driven by fundamental data. Note that our analysis may not factor in the latest price-sensitive company announcements or qualitative material. Simply Wall St has no position in any stocks mentioned.
Have feedback on this article? Concerned about the content? Get in touch with us directly. Alternatively, email editorial-team (at) simplywallst.com.
