
 Yahoo Finance
 Investors bid Insmed (NASDAQ:INSM) up US$686m despite increasing losses YoY, taking five-year CAGR to 19%
The most you can lose on any stock (assuming you don't use leverage) is 100% of your money. But when you pick a company that is really flourishing, you can make more than 100%. One great example is Insmed Incorporated (NASDAQ:INSM) which saw its share price drive 139% higher over five years. It's also good to see the share price up 57% over the last quarter. This could be related to the recent financial results, released recently - you can catch up on the most recent data by reading our company report.
On the back of a solid 7-day performance, let's check what role the company's fundamentals have played in driving long term shareholder returns.
See our latest analysis for Insmed
Insmed wasn't profitable in the last twelve months, it is unlikely we'll see a strong correlation between its share price and its earnings per share (EPS). Arguably revenue is our next best option. Shareholders of unprofitable companies usually expect strong revenue growth. Some companies are willing to postpone profitability to grow revenue faster, but in that case one does expect good top-line growth.
For the last half decade, Insmed can boast revenue growth at a rate of 51% per year. That's well above most pre-profit companies. Meanwhile, its share price performance certainly reflects the strong growth, given the share price grew at 19% per year, compound, during the period. So it seems likely that buyers have paid attention to the strong revenue growth. To our minds that makes Insmed worth investigating - it may have its best days ahead.
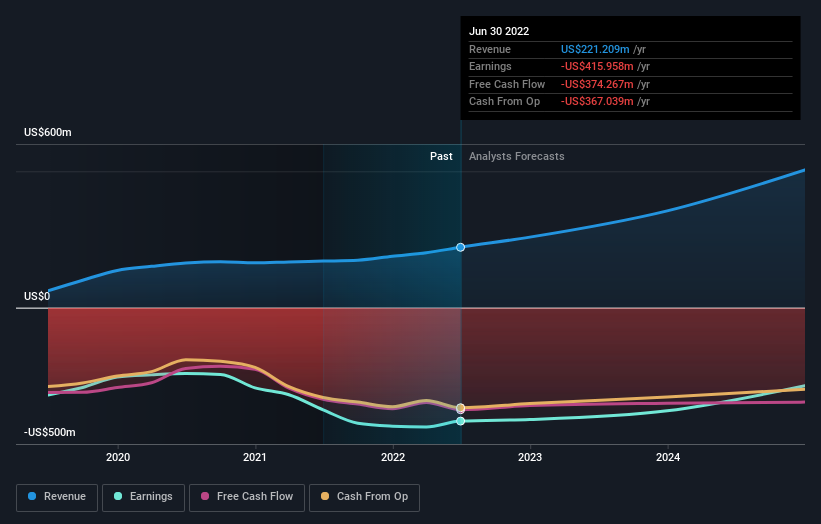
You can see how earnings and revenue have changed over time in the image below (click on the chart to see the exact values).
It's probably worth noting we've seen significant insider buying in the last quarter, which we consider a positive. On the other hand, we think the revenue and earnings trends are much more meaningful measures of the business. You can see what analysts are predicting for Insmed in this interactive graph of future profit estimates.
A Different Perspective
It's nice to see that Insmed shareholders have received a total shareholder return of 8.4% over the last year. However, that falls short of the 19% TSR per annum it has made for shareholders, each year, over five years. Potential buyers might understandably feel they've missed the opportunity, but it's always possible business is still firing on all cylinders. It's always interesting to track share price performance over the longer term. But to understand Insmed better, we need to consider many other factors. Even so, be aware that Insmed is showing 3 warning signs in our investment analysis , you should know about...
Insmed is not the only stock insiders are buying. So take a peek at this free list of growing companies with insider buying.
Please note, the market returns quoted in this article reflect the market weighted average returns of stocks that currently trade on US exchanges.
Have feedback on this article? Concerned about the content? Get in touch with us directly. Alternatively, email editorial-team (at) simplywallst.com.
This article by Simply Wall St is general in nature. We provide commentary based on historical data and analyst forecasts only using an unbiased methodology and our articles are not intended to be financial advice. It does not constitute a recommendation to buy or sell any stock, and does not take account of your objectives, or your financial situation. We aim to bring you long-term focused analysis driven by fundamental data. Note that our analysis may not factor in the latest price-sensitive company announcements or qualitative material. Simply Wall St has no position in any stocks mentioned.
Join A Paid User Research Session
You’ll receive a US$30 Amazon Gift card for 1 hour of your time while helping us build better investing tools for the individual investors like yourself. Sign up here
