
 Yahoo Finance
 Investors in Archer-Daniels-Midland (NYSE:ADM) have seen strong returns of 100% over the past three years
Archer-Daniels-Midland Company (NYSE:ADM) shareholders might be concerned after seeing the share price drop 11% in the last quarter. But over three years, the returns would have left most investors smiling In the last three years the share price is up, 87%: better than the market.
So let's investigate and see if the longer term performance of the company has been in line with the underlying business' progress.
See our latest analysis for Archer-Daniels-Midland
In his essay The Superinvestors of Graham-and-Doddsville Warren Buffett described how share prices do not always rationally reflect the value of a business. By comparing earnings per share (EPS) and share price changes over time, we can get a feel for how investor attitudes to a company have morphed over time.
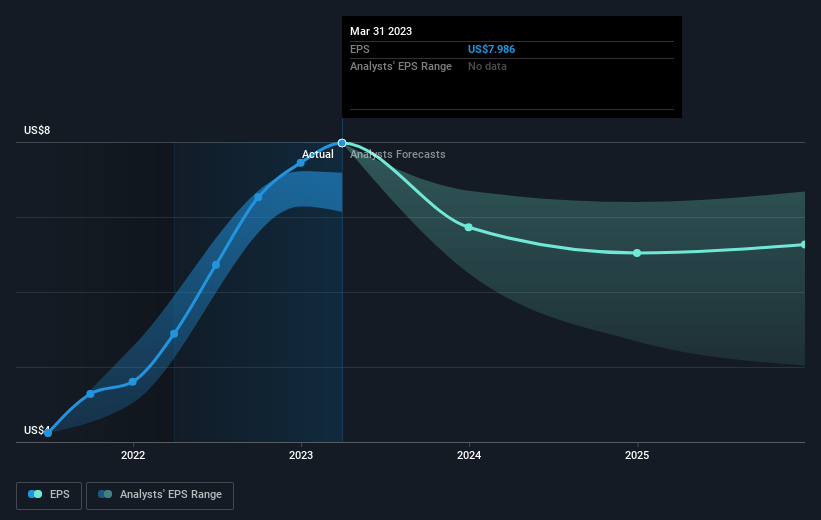
During three years of share price growth, Archer-Daniels-Midland achieved compound earnings per share growth of 44% per year. The average annual share price increase of 23% is actually lower than the EPS growth. So it seems investors have become more cautious about the company, over time. We'd venture the lowish P/E ratio of 8.90 also reflects the negative sentiment around the stock.
The company's earnings per share (over time) is depicted in the image below (click to see the exact numbers).
We know that Archer-Daniels-Midland has improved its bottom line over the last three years, but what does the future have in store? Take a more thorough look at Archer-Daniels-Midland's financial health with this free report on its balance sheet.
What About Dividends?
When looking at investment returns, it is important to consider the difference between total shareholder return (TSR) and share price return. Whereas the share price return only reflects the change in the share price, the TSR includes the value of dividends (assuming they were reinvested) and the benefit of any discounted capital raising or spin-off. So for companies that pay a generous dividend, the TSR is often a lot higher than the share price return. As it happens, Archer-Daniels-Midland's TSR for the last 3 years was 100%, which exceeds the share price return mentioned earlier. And there's no prize for guessing that the dividend payments largely explain the divergence!
A Different Perspective
Investors in Archer-Daniels-Midland had a tough year, with a total loss of 16% (including dividends), against a market gain of about 1.7%. Even the share prices of good stocks drop sometimes, but we want to see improvements in the fundamental metrics of a business, before getting too interested. Longer term investors wouldn't be so upset, since they would have made 14%, each year, over five years. It could be that the recent sell-off is an opportunity, so it may be worth checking the fundamental data for signs of a long term growth trend. While it is well worth considering the different impacts that market conditions can have on the share price, there are other factors that are even more important. Consider risks, for instance. Every company has them, and we've spotted 1 warning sign for Archer-Daniels-Midland you should know about.
If you would prefer to check out another company -- one with potentially superior financials -- then do not miss this free list of companies that have proven they can grow earnings.
Please note, the market returns quoted in this article reflect the market weighted average returns of stocks that currently trade on American exchanges.
Have feedback on this article? Concerned about the content? Get in touch with us directly. Alternatively, email editorial-team (at) simplywallst.com.
This article by Simply Wall St is general in nature. We provide commentary based on historical data and analyst forecasts only using an unbiased methodology and our articles are not intended to be financial advice. It does not constitute a recommendation to buy or sell any stock, and does not take account of your objectives, or your financial situation. We aim to bring you long-term focused analysis driven by fundamental data. Note that our analysis may not factor in the latest price-sensitive company announcements or qualitative material. Simply Wall St has no position in any stocks mentioned.
Join A Paid User Research Session
You’ll receive a US$30 Amazon Gift card for 1 hour of your time while helping us build better investing tools for the individual investors like yourself. Sign up here
