
 Yahoo Finance
 Investors in AGF Management (TSE:AGF.B) have made a favorable return of 62% over the past three years
By buying an index fund, you can roughly match the market return with ease. But if you pick the right individual stocks, you could make more than that. For example, AGF Management Limited (TSE:AGF.B) shareholders have seen the share price rise 37% over three years, well in excess of the market return (27%, not including dividends).
So let's investigate and see if the longer term performance of the company has been in line with the underlying business' progress.
View our latest analysis for AGF Management
While markets are a powerful pricing mechanism, share prices reflect investor sentiment, not just underlying business performance. One way to examine how market sentiment has changed over time is to look at the interaction between a company's share price and its earnings per share (EPS).
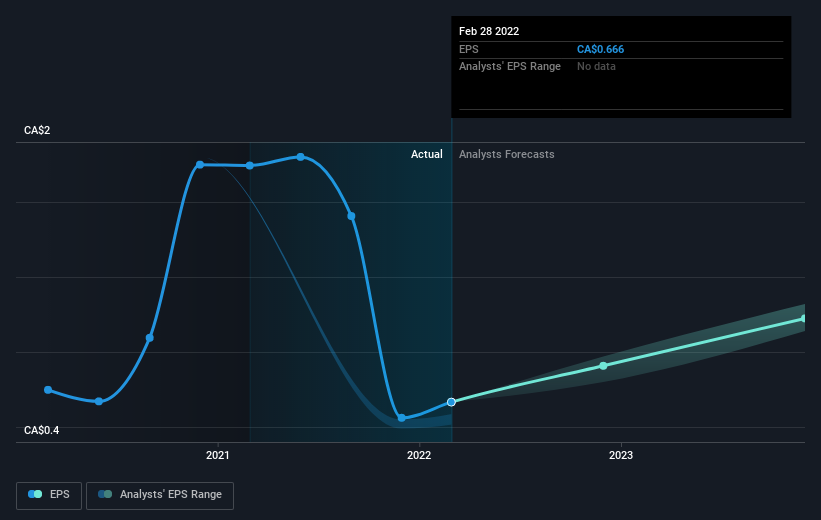
During three years of share price growth, AGF Management achieved compound earnings per share growth of 1.0% per year. This EPS growth is lower than the 11% average annual increase in the share price. This suggests that, as the business progressed over the last few years, it gained the confidence of market participants. That's not necessarily surprising considering the three-year track record of earnings growth.
The image below shows how EPS has tracked over time (if you click on the image you can see greater detail).
It might be well worthwhile taking a look at our free report on AGF Management's earnings, revenue and cash flow.
What About Dividends?
When looking at investment returns, it is important to consider the difference between total shareholder return (TSR) and share price return. The TSR incorporates the value of any spin-offs or discounted capital raisings, along with any dividends, based on the assumption that the dividends are reinvested. Arguably, the TSR gives a more comprehensive picture of the return generated by a stock. As it happens, AGF Management's TSR for the last 3 years was 62%, which exceeds the share price return mentioned earlier. This is largely a result of its dividend payments!
A Different Perspective
AGF Management shareholders are down 2.4% for the year (even including dividends), but the market itself is up 11%. Even the share prices of good stocks drop sometimes, but we want to see improvements in the fundamental metrics of a business, before getting too interested. On the bright side, long term shareholders have made money, with a gain of 6% per year over half a decade. It could be that the recent sell-off is an opportunity, so it may be worth checking the fundamental data for signs of a long term growth trend. While it is well worth considering the different impacts that market conditions can have on the share price, there are other factors that are even more important. Even so, be aware that AGF Management is showing 1 warning sign in our investment analysis , you should know about...
If you are like me, then you will not want to miss this free list of growing companies that insiders are buying.
Please note, the market returns quoted in this article reflect the market weighted average returns of stocks that currently trade on CA exchanges.
Have feedback on this article? Concerned about the content? Get in touch with us directly. Alternatively, email editorial-team (at) simplywallst.com.
This article by Simply Wall St is general in nature. We provide commentary based on historical data and analyst forecasts only using an unbiased methodology and our articles are not intended to be financial advice. It does not constitute a recommendation to buy or sell any stock, and does not take account of your objectives, or your financial situation. We aim to bring you long-term focused analysis driven by fundamental data. Note that our analysis may not factor in the latest price-sensitive company announcements or qualitative material. Simply Wall St has no position in any stocks mentioned.
