
 Yahoo Finance
 Investing in Triton International (NYSE:TRTN) five years ago would have delivered you a 175% gain
When you buy shares in a company, it's worth keeping in mind the possibility that it could fail, and you could lose your money. But on the bright side, you can make far more than 100% on a really good stock. For instance, the price of Triton International Limited (NYSE:TRTN) stock is up an impressive 109% over the last five years. We note the stock price is up 1.3% in the last seven days.
So let's investigate and see if the longer term performance of the company has been in line with the underlying business' progress.
See our latest analysis for Triton International
In his essay The Superinvestors of Graham-and-Doddsville Warren Buffett described how share prices do not always rationally reflect the value of a business. One way to examine how market sentiment has changed over time is to look at the interaction between a company's share price and its earnings per share (EPS).
During five years of share price growth, Triton International achieved compound earnings per share (EPS) growth of 113% per year. The EPS growth is more impressive than the yearly share price gain of 16% over the same period. So it seems the market isn't so enthusiastic about the stock these days. The reasonably low P/E ratio of 7.39 also suggests market apprehension.
The graphic below depicts how EPS has changed over time (unveil the exact values by clicking on the image).
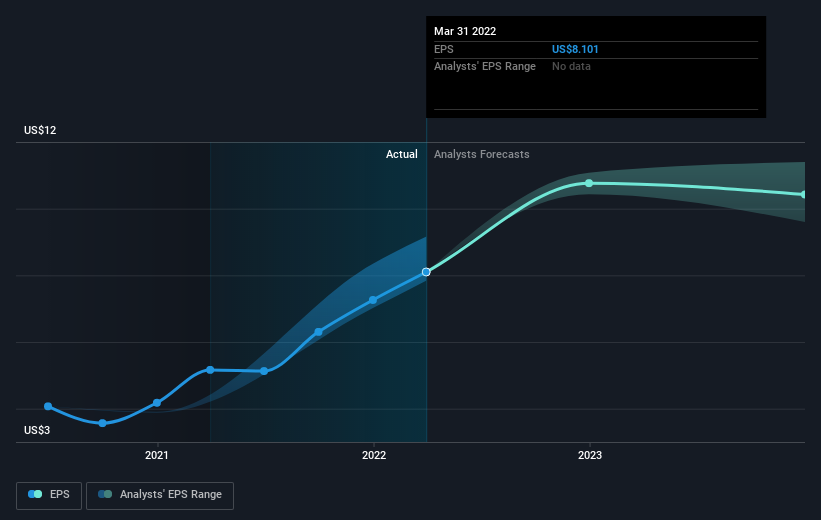
We know that Triton International has improved its bottom line lately, but is it going to grow revenue? You could check out this free report showing analyst revenue forecasts.
What About Dividends?
It is important to consider the total shareholder return, as well as the share price return, for any given stock. The TSR incorporates the value of any spin-offs or discounted capital raisings, along with any dividends, based on the assumption that the dividends are reinvested. So for companies that pay a generous dividend, the TSR is often a lot higher than the share price return. We note that for Triton International the TSR over the last 5 years was 175%, which is better than the share price return mentioned above. And there's no prize for guessing that the dividend payments largely explain the divergence!
A Different Perspective
It's nice to see that Triton International shareholders have received a total shareholder return of 23% over the last year. Of course, that includes the dividend. That's better than the annualised return of 22% over half a decade, implying that the company is doing better recently. Given the share price momentum remains strong, it might be worth taking a closer look at the stock, lest you miss an opportunity. It's always interesting to track share price performance over the longer term. But to understand Triton International better, we need to consider many other factors. Take risks, for example - Triton International has 3 warning signs (and 2 which can't be ignored) we think you should know about.
If you like to buy stocks alongside management, then you might just love this free list of companies. (Hint: insiders have been buying them).
Please note, the market returns quoted in this article reflect the market weighted average returns of stocks that currently trade on US exchanges.
Have feedback on this article? Concerned about the content? Get in touch with us directly. Alternatively, email editorial-team (at) simplywallst.com.
This article by Simply Wall St is general in nature. We provide commentary based on historical data and analyst forecasts only using an unbiased methodology and our articles are not intended to be financial advice. It does not constitute a recommendation to buy or sell any stock, and does not take account of your objectives, or your financial situation. We aim to bring you long-term focused analysis driven by fundamental data. Note that our analysis may not factor in the latest price-sensitive company announcements or qualitative material. Simply Wall St has no position in any stocks mentioned.
