
 Yahoo Finance
 Investing in Energy Recovery (NASDAQ:ERII) three years ago would have delivered you a 182% gain
The most you can lose on any stock (assuming you don't use leverage) is 100% of your money. But when you pick a company that is really flourishing, you can make more than 100%. To wit, the Energy Recovery, Inc. (NASDAQ:ERII) share price has flown 182% in the last three years. That sort of return is as solid as granite. Then again, the 8.2% share price decline hasn't been so fun for shareholders. We note that the broader market is down 1.9% in the last month, and this may have impacted Energy Recovery's share price.
Now it's worth having a look at the company's fundamentals too, because that will help us determine if the long term shareholder return has matched the performance of the underlying business.
View our latest analysis for Energy Recovery
While the efficient markets hypothesis continues to be taught by some, it has been proven that markets are over-reactive dynamic systems, and investors are not always rational. One flawed but reasonable way to assess how sentiment around a company has changed is to compare the earnings per share (EPS) with the share price.
Over the last three years, Energy Recovery failed to grow earnings per share, which fell 29% (annualized).
This means it's unlikely the market is judging the company based on earnings growth. Therefore, we think it's worth considering other metrics as well.
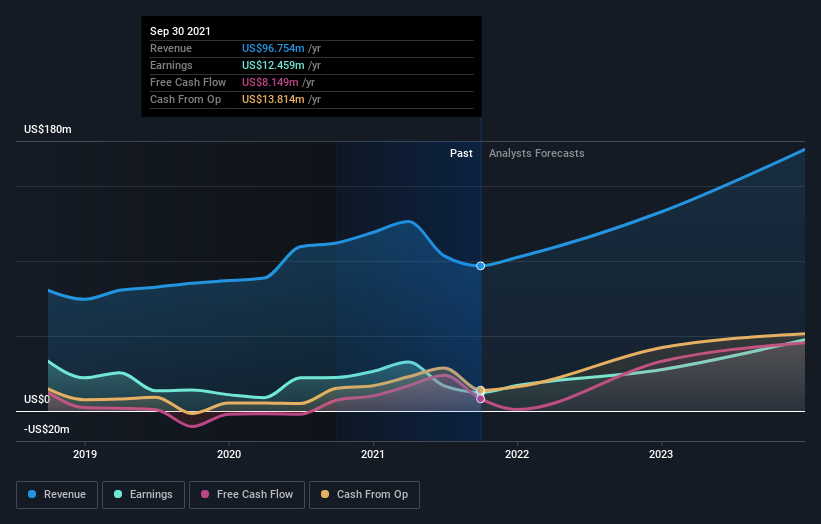
It may well be that Energy Recovery revenue growth rate of 14% over three years has convinced shareholders to believe in a brighter future. If the company is being managed for the long term good, today's shareholders might be right to hold on.
The graphic below depicts how earnings and revenue have changed over time (unveil the exact values by clicking on the image).
This free interactive report on Energy Recovery's balance sheet strength is a great place to start, if you want to investigate the stock further.
A Different Perspective
It's good to see that Energy Recovery has rewarded shareholders with a total shareholder return of 66% in the last twelve months. That gain is better than the annual TSR over five years, which is 12%. Therefore it seems like sentiment around the company has been positive lately. Someone with an optimistic perspective could view the recent improvement in TSR as indicating that the business itself is getting better with time. It's always interesting to track share price performance over the longer term. But to understand Energy Recovery better, we need to consider many other factors. To that end, you should be aware of the 2 warning signs we've spotted with Energy Recovery .
For those who like to find winning investments this free list of growing companies with recent insider purchasing, could be just the ticket.
Please note, the market returns quoted in this article reflect the market weighted average returns of stocks that currently trade on US exchanges.
Have feedback on this article? Concerned about the content? Get in touch with us directly. Alternatively, email editorial-team (at) simplywallst.com.
This article by Simply Wall St is general in nature. We provide commentary based on historical data and analyst forecasts only using an unbiased methodology and our articles are not intended to be financial advice. It does not constitute a recommendation to buy or sell any stock, and does not take account of your objectives, or your financial situation. We aim to bring you long-term focused analysis driven by fundamental data. Note that our analysis may not factor in the latest price-sensitive company announcements or qualitative material. Simply Wall St has no position in any stocks mentioned.
