
 Yahoo Finance
 Investing in Broadcom (NASDAQ:AVGO) three years ago would have delivered you a 207% gain
The worst result, after buying shares in a company (assuming no leverage), would be if you lose all the money you put in. But when you pick a company that is really flourishing, you can make more than 100%. For example, the Broadcom Inc. (NASDAQ:AVGO) share price has soared 179% in the last three years. That sort of return is as solid as granite. On top of that, the share price is up 12% in about a quarter. This could be related to the recent financial results, released recently - you can catch up on the most recent data by reading our company report.
So let's investigate and see if the longer term performance of the company has been in line with the underlying business' progress.
See our latest analysis for Broadcom
There is no denying that markets are sometimes efficient, but prices do not always reflect underlying business performance. One imperfect but simple way to consider how the market perception of a company has shifted is to compare the change in the earnings per share (EPS) with the share price movement.
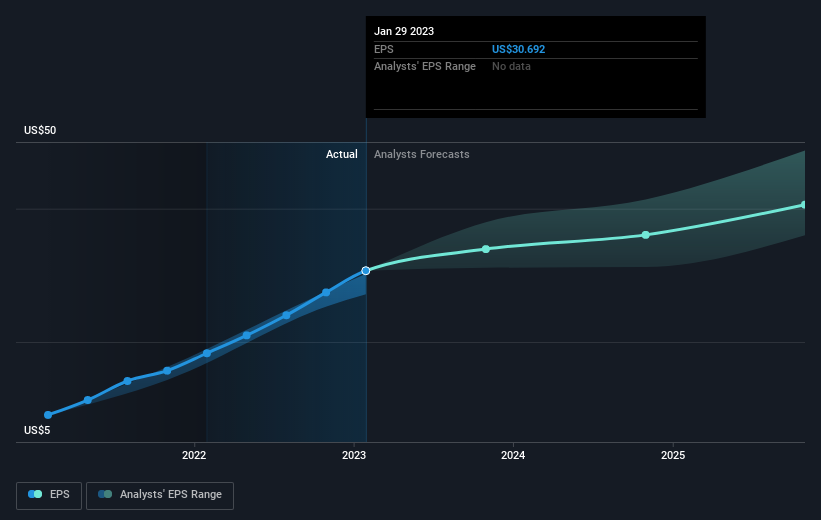
During three years of share price growth, Broadcom achieved compound earnings per share growth of 68% per year. This EPS growth is higher than the 41% average annual increase in the share price. Therefore, it seems the market has moderated its expectations for growth, somewhat.
You can see how EPS has changed over time in the image below (click on the chart to see the exact values).
It is of course excellent to see how Broadcom has grown profits over the years, but the future is more important for shareholders. This free interactive report on Broadcom's balance sheet strength is a great place to start, if you want to investigate the stock further.
What About Dividends?
When looking at investment returns, it is important to consider the difference between total shareholder return (TSR) and share price return. Whereas the share price return only reflects the change in the share price, the TSR includes the value of dividends (assuming they were reinvested) and the benefit of any discounted capital raising or spin-off. Arguably, the TSR gives a more comprehensive picture of the return generated by a stock. As it happens, Broadcom's TSR for the last 3 years was 207%, which exceeds the share price return mentioned earlier. And there's no prize for guessing that the dividend payments largely explain the divergence!
A Different Perspective
It's good to see that Broadcom has rewarded shareholders with a total shareholder return of 2.2% in the last twelve months. And that does include the dividend. Having said that, the five-year TSR of 26% a year, is even better. The pessimistic view would be that be that the stock has its best days behind it, but on the other hand the price might simply be moderating while the business itself continues to execute. While it is well worth considering the different impacts that market conditions can have on the share price, there are other factors that are even more important. Consider for instance, the ever-present spectre of investment risk. We've identified 3 warning signs with Broadcom , and understanding them should be part of your investment process.
If you are like me, then you will not want to miss this free list of growing companies that insiders are buying.
Please note, the market returns quoted in this article reflect the market weighted average returns of stocks that currently trade on American exchanges.
Have feedback on this article? Concerned about the content? Get in touch with us directly. Alternatively, email editorial-team (at) simplywallst.com.
This article by Simply Wall St is general in nature. We provide commentary based on historical data and analyst forecasts only using an unbiased methodology and our articles are not intended to be financial advice. It does not constitute a recommendation to buy or sell any stock, and does not take account of your objectives, or your financial situation. We aim to bring you long-term focused analysis driven by fundamental data. Note that our analysis may not factor in the latest price-sensitive company announcements or qualitative material. Simply Wall St has no position in any stocks mentioned.
Join A Paid User Research Session
You’ll receive a US$30 Amazon Gift card for 1 hour of your time while helping us build better investing tools for the individual investors like yourself. Sign up here
