
 Yahoo Finance
 Investing in Associated Capital Group (NYSE:AC) five years ago would have delivered you a 16% gain
When you buy and hold a stock for the long term, you definitely want it to provide a positive return. Furthermore, you'd generally like to see the share price rise faster than the market. Unfortunately for shareholders, while the Associated Capital Group, Inc. (NYSE:AC) share price is up 12% in the last five years, that's less than the market return. Unfortunately the share price is down 3.2% in the last year.
Now it's worth having a look at the company's fundamentals too, because that will help us determine if the long term shareholder return has matched the performance of the underlying business.
See our latest analysis for Associated Capital Group
Associated Capital Group isn't currently profitable, so most analysts would look to revenue growth to get an idea of how fast the underlying business is growing. Shareholders of unprofitable companies usually expect strong revenue growth. That's because fast revenue growth can be easily extrapolated to forecast profits, often of considerable size.
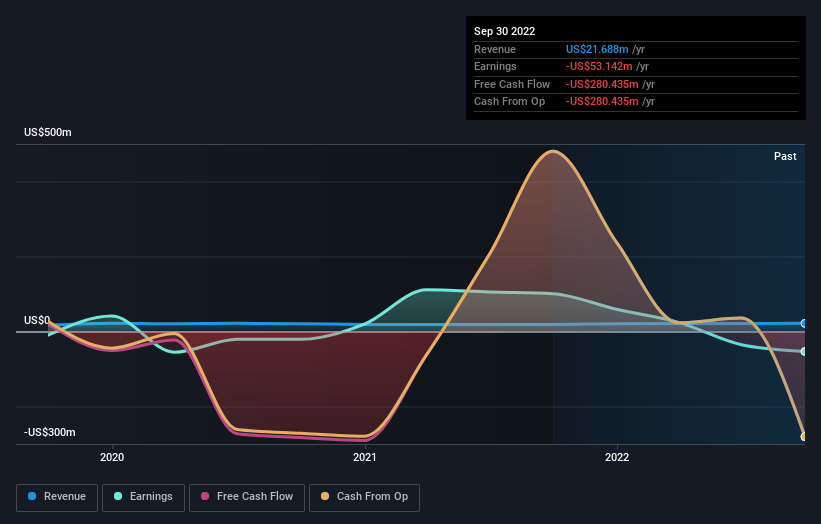
In the last 5 years Associated Capital Group saw its revenue shrink by 7.1% per year. The falling revenue is arguably somewhat reflected in the lacklustre return of 2% per year over that time. Arguably that's not bad given the soft revenue and loss-making position. We'd keep an eye on changes in the trend - there may be an opportunity if the company returns to growth.
The graphic below depicts how earnings and revenue have changed over time (unveil the exact values by clicking on the image).
Balance sheet strength is crucial. It might be well worthwhile taking a look at our free report on how its financial position has changed over time.
What About Dividends?
When looking at investment returns, it is important to consider the difference between total shareholder return (TSR) and share price return. The TSR is a return calculation that accounts for the value of cash dividends (assuming that any dividend received was reinvested) and the calculated value of any discounted capital raisings and spin-offs. So for companies that pay a generous dividend, the TSR is often a lot higher than the share price return. In the case of Associated Capital Group, it has a TSR of 16% for the last 5 years. That exceeds its share price return that we previously mentioned. This is largely a result of its dividend payments!
A Different Perspective
While it's never nice to take a loss, Associated Capital Group shareholders can take comfort that , including dividends,their trailing twelve month loss of 2.6% wasn't as bad as the market loss of around 7.6%. Of course, the long term returns are far more important and the good news is that over five years, the stock has returned 3% for each year. In the best case scenario the last year is just a temporary blip on the journey to a brighter future. Shareholders might want to examine this detailed historical graph of past earnings, revenue and cash flow.
We will like Associated Capital Group better if we see some big insider buys. While we wait, check out this free list of growing companies with considerable, recent, insider buying.
Please note, the market returns quoted in this article reflect the market weighted average returns of stocks that currently trade on US exchanges.
Have feedback on this article? Concerned about the content? Get in touch with us directly. Alternatively, email editorial-team (at) simplywallst.com.
This article by Simply Wall St is general in nature. We provide commentary based on historical data and analyst forecasts only using an unbiased methodology and our articles are not intended to be financial advice. It does not constitute a recommendation to buy or sell any stock, and does not take account of your objectives, or your financial situation. We aim to bring you long-term focused analysis driven by fundamental data. Note that our analysis may not factor in the latest price-sensitive company announcements or qualitative material. Simply Wall St has no position in any stocks mentioned.
Join A Paid User Research Session
You’ll receive a US$30 Amazon Gift card for 1 hour of your time while helping us build better investing tools for the individual investors like yourself. Sign up here
