
 Yahoo Finance
 Introducing Trecora Resources (NYSE:TREC), The Stock That Slid 57% In The Last Five Years

Statistically speaking, long term investing is a profitable endeavour. But unfortunately, some companies simply don't succeed. Zooming in on an example, the Trecora Resources (NYSE:TREC) share price dropped 57% in the last half decade. That's not a lot of fun for true believers. We also note that the stock has performed poorly over the last year, with the share price down 35%. Shareholders have had an even rougher run lately, with the share price down 18% in the last 90 days.
Check out our latest analysis for Trecora Resources
To quote Buffett, 'Ships will sail around the world but the Flat Earth Society will flourish. There will continue to be wide discrepancies between price and value in the marketplace...' One imperfect but simple way to consider how the market perception of a company has shifted is to compare the change in the earnings per share (EPS) with the share price movement.
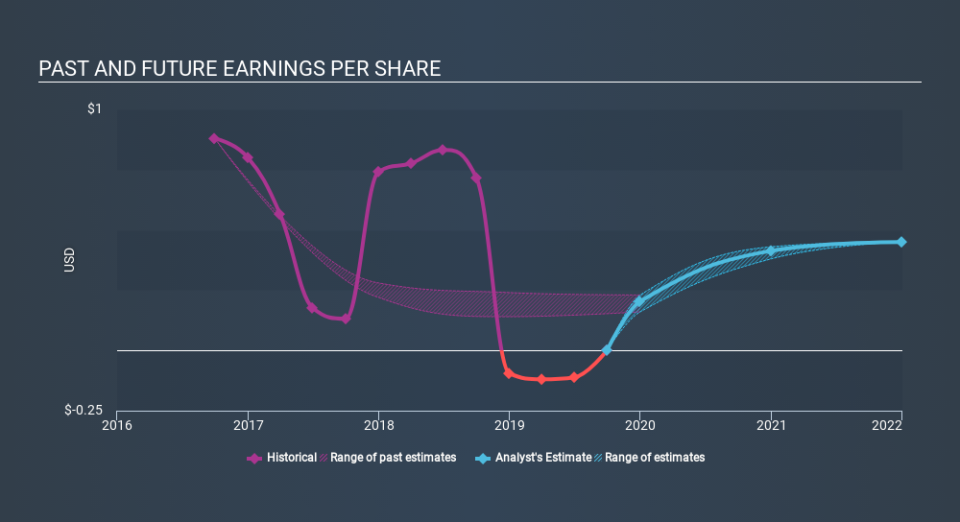
Looking back five years, both Trecora Resources's share price and EPS declined; the latter at a rate of 71% per year. This was, in part, due to extraordinary items impacting earnings. The share price decline of 16% per year isn't as bad as the EPS decline. So the market may previously have expected a drop, or else it expects the situation will improve. With a P/E ratio of 4.43k, it's fair to say the market sees a brighter future for the business.
You can see how EPS has changed over time in the image below (click on the chart to see the exact values).
Before buying or selling a stock, we always recommend a close examination of historic growth trends, available here.
A Different Perspective
While the broader market gained around 16% in the last year, Trecora Resources shareholders lost 35%. However, keep in mind that even the best stocks will sometimes underperform the market over a twelve month period. Regrettably, last year's performance caps off a bad run, with the shareholders facing a total loss of 16% per year over five years. Generally speaking long term share price weakness can be a bad sign, though contrarian investors might want to research the stock in hope of a turnaround. I find it very interesting to look at share price over the long term as a proxy for business performance. But to truly gain insight, we need to consider other information, too. For example, we've discovered 4 warning signs for Trecora Resources (1 makes us a bit uncomfortable!) that you should be aware of before investing here.
If you like to buy stocks alongside management, then you might just love this free list of companies. (Hint: insiders have been buying them).
Please note, the market returns quoted in this article reflect the market weighted average returns of stocks that currently trade on US exchanges.
If you spot an error that warrants correction, please contact the editor at editorial-team@simplywallst.com. This article by Simply Wall St is general in nature. It does not constitute a recommendation to buy or sell any stock, and does not take account of your objectives, or your financial situation. Simply Wall St has no position in the stocks mentioned.
We aim to bring you long-term focused research analysis driven by fundamental data. Note that our analysis may not factor in the latest price-sensitive company announcements or qualitative material. Thank you for reading.
