
 Yahoo Finance
 Introducing Secure Energy Services (TSE:SES), The Stock That Slid 67% In The Last Five Years

Want to participate in a short research study? Help shape the future of investing tools and you could win a $250 gift card!
Statistically speaking, long term investing is a profitable endeavour. But no-one is immune from buying too high. Zooming in on an example, the Secure Energy Services Inc. (TSE:SES) share price dropped 67% in the last half decade. That is extremely sub-optimal, to say the least. Shareholders have had an even rougher run lately, with the share price down 16% in the last 90 days.
View our latest analysis for Secure Energy Services
To quote Buffett, 'Ships will sail around the world but the Flat Earth Society will flourish. There will continue to be wide discrepancies between price and value in the marketplace...' By comparing earnings per share (EPS) and share price changes over time, we can get a feel for how investor attitudes to a company have morphed over time.
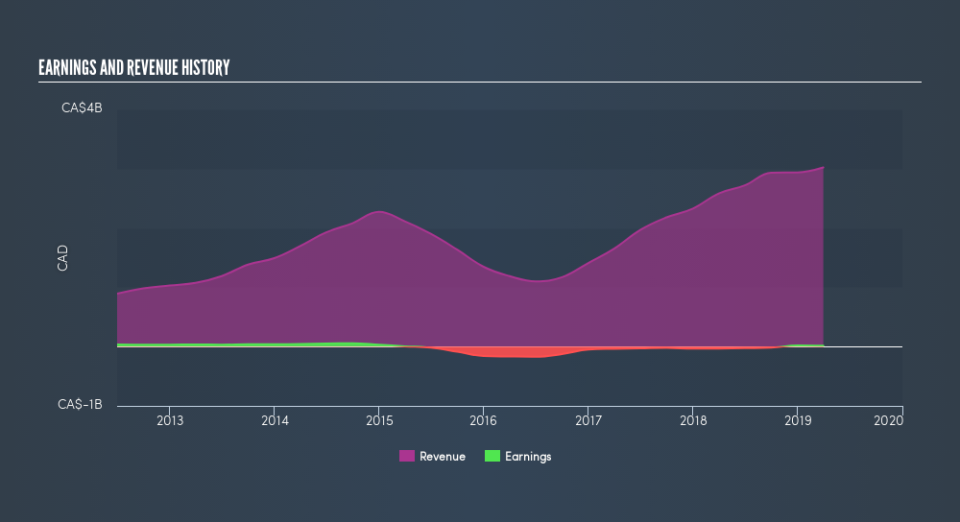
Secure Energy Services became profitable within the last five years. That would generally be considered a positive, so we are surprised to see the share price is down. Other metrics may better explain the share price move.
Revenue is actually up 11% over the time period. So it seems one might have to take closer look at the fundamentals to understand why the share price languishes. After all, there may be an opportunity.
Depicted in the graphic below, you'll see revenue and earnings over time. If you want more detail, you can click on the chart itself.
We know that Secure Energy Services has improved its bottom line over the last three years, but what does the future have in store? It might be well worthwhile taking a look at our free report on how its financial position has changed over time.
What About Dividends?
As well as measuring the share price return, investors should also consider the total shareholder return (TSR). Whereas the share price return only reflects the change in the share price, the TSR includes the value of dividends (assuming they were reinvested) and the benefit of any discounted capital raising or spin-off. Arguably, the TSR gives a more comprehensive picture of the return generated by a stock. We note that for Secure Energy Services the TSR over the last 5 years was -62%, which is better than the share price return mentioned above. The dividends paid by the company have thusly boosted the total shareholder return.
A Different Perspective
While the broader market gained around 0.7% in the last year, Secure Energy Services shareholders lost 6.6% (even including dividends). However, keep in mind that even the best stocks will sometimes underperform the market over a twelve month period. Unfortunately, longer term shareholders are suffering worse, given the loss of 18% doled out over the last five years. We would want clear information suggesting the company will grow, before taking the view that the share price will stabilize. Before spending more time on Secure Energy Services it might be wise to click here to see if insiders have been buying or selling shares.
Of course, you might find a fantastic investment by looking elsewhere. So take a peek at this free list of companies we expect will grow earnings.
Please note, the market returns quoted in this article reflect the market weighted average returns of stocks that currently trade on CA exchanges.
We aim to bring you long-term focused research analysis driven by fundamental data. Note that our analysis may not factor in the latest price-sensitive company announcements or qualitative material.
If you spot an error that warrants correction, please contact the editor at editorial-team@simplywallst.com. This article by Simply Wall St is general in nature. It does not constitute a recommendation to buy or sell any stock, and does not take account of your objectives, or your financial situation. Simply Wall St has no position in the stocks mentioned. Thank you for reading.
