
 Yahoo Finance
 Introducing Elastic (NYSE:ESTC), The Stock That Dropped 10% In The Last Year

Investors can approximate the average market return by buying an index fund. While individual stocks can be big winners, plenty more fail to generate satisfactory returns. Unfortunately the Elastic N.V. (NYSE:ESTC) share price slid 10% over twelve months. That's disappointing when you consider the market returned 31%. Because Elastic hasn't been listed for many years, the market is still learning about how the business performs. It's down 20% in about a quarter. We note that the company has reported results fairly recently; and the market is hardly delighted. You can check out the latest numbers in our company report.
Check out our latest analysis for Elastic
Elastic wasn't profitable in the last twelve months, it is unlikely we'll see a strong correlation between its share price and its earnings per share (EPS). Arguably revenue is our next best option. Shareholders of unprofitable companies usually expect strong revenue growth. As you can imagine, fast revenue growth, when maintained, often leads to fast profit growth.
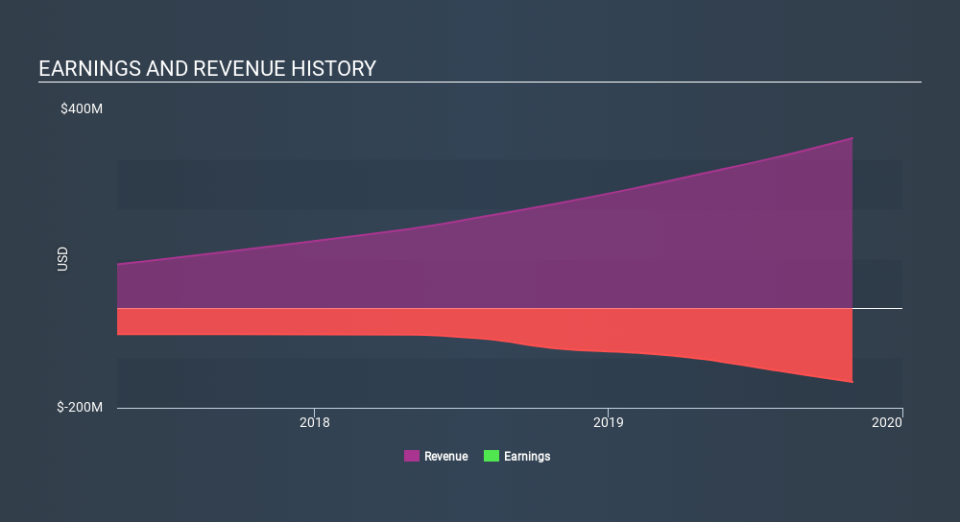
In the last twelve months, Elastic increased its revenue by 62%. That's a strong result which is better than most other loss making companies. The share price drop of 10% over twelve months would be considered disappointing by many, so you might argue the company is getting little credit for its impressive revenue growth. Prima facie, revenue growth like that should be a good thing, so it's worth checking whether losses have stabilized. Our brains have evolved to think in linear fashion, so there's value in learning to recognize exponential growth. We are, in some ways, simply the wisest of the monkeys.
The company's revenue and earnings (over time) are depicted in the image below (click to see the exact numbers).
It's probably worth noting that the CEO is paid less than the median at similar sized companies. But while CEO remuneration is always worth checking, the really important question is whether the company can grow earnings going forward. This free report showing analyst forecasts should help you form a view on Elastic
A Different Perspective
While Elastic shareholders are down 10% for the year, the market itself is up 31%. However, keep in mind that even the best stocks will sometimes underperform the market over a twelve month period. It's worth noting that the last three months did the real damage, with a 20% decline. This probably signals that the business has recently disappointed shareholders - it will take time to win them back. Most investors take the time to check the data on insider transactions. You can click here to see if insiders have been buying or selling.
Of course, you might find a fantastic investment by looking elsewhere. So take a peek at this free list of companies we expect will grow earnings.
Please note, the market returns quoted in this article reflect the market weighted average returns of stocks that currently trade on US exchanges.
If you spot an error that warrants correction, please contact the editor at editorial-team@simplywallst.com. This article by Simply Wall St is general in nature. It does not constitute a recommendation to buy or sell any stock, and does not take account of your objectives, or your financial situation. Simply Wall St has no position in the stocks mentioned.
We aim to bring you long-term focused research analysis driven by fundamental data. Note that our analysis may not factor in the latest price-sensitive company announcements or qualitative material. Thank you for reading.
