
 Yahoo Finance
 Introducing Brady (NYSE:BRC), The Stock That Zoomed 117% In The Last Five Years

The most you can lose on any stock (assuming you don't use leverage) is 100% of your money. But on a lighter note, a good company can see its share price rise well over 100%. For example, the Brady Corporation (NYSE:BRC) share price has soared 117% in the last half decade. Most would be very happy with that. Also pleasing for shareholders was the 12% gain in the last three months. But this move may well have been assisted by the reasonably buoyant market (up 13% in 90 days).
Check out our latest analysis for Brady
While markets are a powerful pricing mechanism, share prices reflect investor sentiment, not just underlying business performance. One imperfect but simple way to consider how the market perception of a company has shifted is to compare the change in the earnings per share (EPS) with the share price movement.
During the last half decade, Brady became profitable. Sometimes, the start of profitability is a major inflection point that can signal fast earnings growth to come, which in turn justifies very strong share price gains. Given that the company made a profit three years ago, but not five years ago, it is worth looking at the share price returns over the last three years, too. Indeed, the Brady share price has gained 62% in three years. Meanwhile, EPS is up 16% per year. This EPS growth is reasonably close to the 17% average annual increase in the share price (over three years, again). So you could reasonably conclude that investor sentiment towards the stock has remained pretty steady, over time. Rather, the share price has approximately tracked EPS growth.
The image below shows how EPS has tracked over time (if you click on the image you can see greater detail).
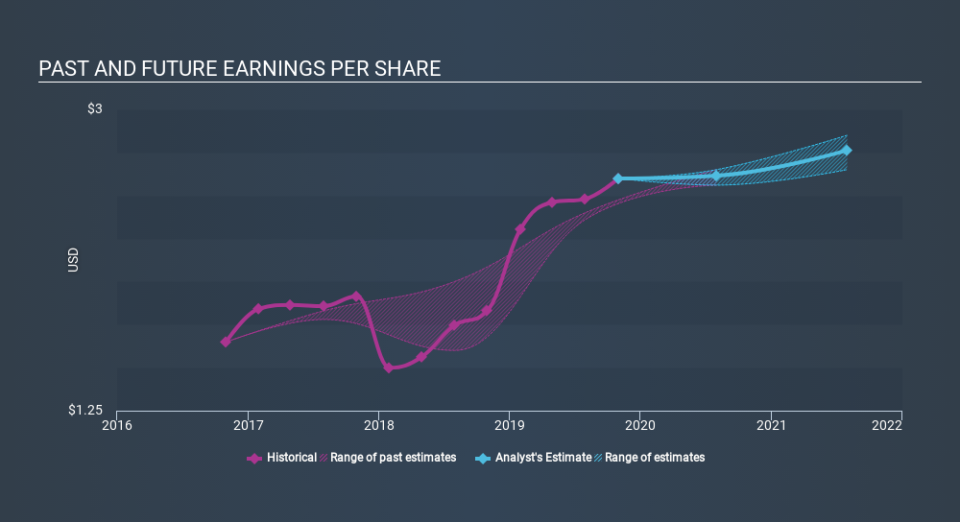
We know that Brady has improved its bottom line lately, but is it going to grow revenue? This free report showing analyst revenue forecasts should help you figure out if the EPS growth can be sustained.
What About Dividends?
As well as measuring the share price return, investors should also consider the total shareholder return (TSR). The TSR incorporates the value of any spin-offs or discounted capital raisings, along with any dividends, based on the assumption that the dividends are reinvested. So for companies that pay a generous dividend, the TSR is often a lot higher than the share price return. As it happens, Brady's TSR for the last 5 years was 144%, which exceeds the share price return mentioned earlier. And there's no prize for guessing that the dividend payments largely explain the divergence!
A Different Perspective
It's nice to see that Brady shareholders have received a total shareholder return of 32% over the last year. And that does include the dividend. That's better than the annualised return of 20% over half a decade, implying that the company is doing better recently. Someone with an optimistic perspective could view the recent improvement in TSR as indicating that the business itself is getting better with time. If you would like to research Brady in more detail then you might want to take a look at whether insiders have been buying or selling shares in the company.
If you are like me, then you will not want to miss this free list of growing companies that insiders are buying.
Please note, the market returns quoted in this article reflect the market weighted average returns of stocks that currently trade on US exchanges.
If you spot an error that warrants correction, please contact the editor at editorial-team@simplywallst.com. This article by Simply Wall St is general in nature. It does not constitute a recommendation to buy or sell any stock, and does not take account of your objectives, or your financial situation. Simply Wall St has no position in the stocks mentioned.
We aim to bring you long-term focused research analysis driven by fundamental data. Note that our analysis may not factor in the latest price-sensitive company announcements or qualitative material. Thank you for reading.
