
 Yahoo Finance
 Intouch Insight Ltd.'s (CVE:INX) Share Price Could Signal Some Risk
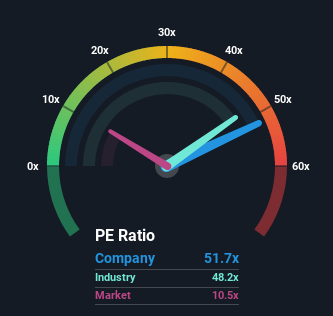
When close to half the companies in Canada have price-to-earnings ratios (or "P/E's") below 10x, you may consider Intouch Insight Ltd. (CVE:INX) as a stock to avoid entirely with its 51.7x P/E ratio. However, the P/E might be quite high for a reason and it requires further investigation to determine if it's justified.
Earnings have risen firmly for Intouch Insight recently, which is pleasing to see. It might be that many expect the respectable earnings performance to beat most other companies over the coming period, which has increased investors’ willingness to pay up for the stock. You'd really hope so, otherwise you're paying a pretty hefty price for no particular reason.
See our latest analysis for Intouch Insight
We don't have analyst forecasts, but you can see how recent trends are setting up the company for the future by checking out our free report on Intouch Insight's earnings, revenue and cash flow.
Does Growth Match The High P/E?
The only time you'd be truly comfortable seeing a P/E as steep as Intouch Insight's is when the company's growth is on track to outshine the market decidedly.
If we review the last year of earnings growth, the company posted a worthy increase of 12%. Although, the latest three year period in total hasn't been as good as it didn't manage to provide any growth at all. Accordingly, shareholders probably wouldn't have been overly satisfied with the unstable medium-term growth rates.
Comparing that to the market, which is predicted to deliver 13% growth in the next 12 months, the company's momentum is weaker based on recent medium-term annualised earnings results.
With this information, we find it concerning that Intouch Insight is trading at a P/E higher than the market. Apparently many investors in the company are way more bullish than recent times would indicate and aren't willing to let go of their stock at any price. Only the boldest would assume these prices are sustainable as a continuation of recent earnings trends is likely to weigh heavily on the share price eventually.
The Bottom Line On Intouch Insight's P/E
We'd say the price-to-earnings ratio's power isn't primarily as a valuation instrument but rather to gauge current investor sentiment and future expectations.
We've established that Intouch Insight currently trades on a much higher than expected P/E since its recent three-year growth is lower than the wider market forecast. When we see weak earnings with slower than market growth, we suspect the share price is at risk of declining, sending the high P/E lower. If recent medium-term earnings trends continue, it will place shareholders' investments at significant risk and potential investors in danger of paying an excessive premium.
Before you take the next step, you should know about the 3 warning signs for Intouch Insight that we have uncovered.
Of course, you might find a fantastic investment by looking at a few good candidates. So take a peek at this free list of companies with a strong growth track record, trading on a P/E below 20x.
Have feedback on this article? Concerned about the content? Get in touch with us directly. Alternatively, email editorial-team (at) simplywallst.com.
This article by Simply Wall St is general in nature. We provide commentary based on historical data and analyst forecasts only using an unbiased methodology and our articles are not intended to be financial advice. It does not constitute a recommendation to buy or sell any stock, and does not take account of your objectives, or your financial situation. We aim to bring you long-term focused analysis driven by fundamental data. Note that our analysis may not factor in the latest price-sensitive company announcements or qualitative material. Simply Wall St has no position in any stocks mentioned.
Join A Paid User Research Session
You’ll receive a US$30 Amazon Gift card for 1 hour of your time while helping us build better investing tools for the individual investors like yourself. Sign up here