
 Yahoo Finance
 Our Take On Intermap Technologies Corporation's (TSE:IMP) CEO Salary

In 2016 Patrick Blott was appointed CEO of Intermap Technologies Corporation (TSE:IMP). This report will, first, examine the CEO compensation levels in comparison to CEO compensation at companies of similar size. Then we'll look at a snap shot of the business growth. Third, we'll reflect on the total return to shareholders over three years, as a second measure of business performance. This process should give us an idea about how appropriately the CEO is paid.
Check out our latest analysis for Intermap Technologies
How Does Patrick Blott's Compensation Compare With Similar Sized Companies?
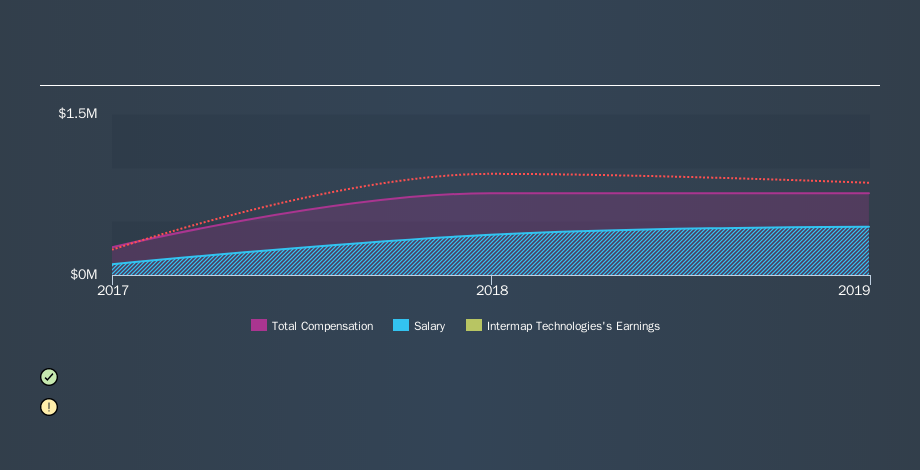
At the time of writing, our data says that Intermap Technologies Corporation has a market cap of CA$3.5m, and reported total annual CEO compensation of US$761k for the year to December 2018. We think total compensation is more important but we note that the CEO salary is lower, at US$450k. We looked at a group of companies with market capitalizations under US$200m, and the median CEO total compensation was US$136k.
As you can see, Patrick Blott is paid more than the median CEO pay at companies of a similar size, in the same market. However, this does not necessarily mean Intermap Technologies Corporation is paying too much. We can get a better idea of how generous the pay is by looking at the performance of the underlying business.
You can see, below, how CEO compensation at Intermap Technologies has changed over time.
Is Intermap Technologies Corporation Growing?
Intermap Technologies Corporation has increased its earnings per share (EPS) by an average of 91% a year, over the last three years (using a line of best fit). Its revenue is down 47% over last year.
Overall this is a positive result for shareholders, showing that the company has improved in recent years. The lack of revenue growth isn't ideal, but it is the bottom line that counts most in business. We don't have analyst forecasts, but shareholders might want to examine this detailed historical graph of earnings, revenue and cash flow.
Has Intermap Technologies Corporation Been A Good Investment?
Since shareholders would have lost about 71% over three years, some Intermap Technologies Corporation shareholders would surely be feeling negative emotions. So shareholders would probably think the company shouldn't be too generous with CEO compensation.
In Summary...
We compared total CEO remuneration at Intermap Technologies Corporation with the amount paid at companies with a similar market capitalization. As discussed above, we discovered that the company pays more than the median of that group.
However we must not forget that the EPS growth has been very strong over three years. On the other hand returns to investors over the same period have probably disappointed many. While EPS is positive, we'd say shareholders would want better returns before the CEO is paid much more. If you think CEO compensation levels are interesting you will probably really like this free visualization of insider trading at Intermap Technologies.
Arguably, business quality is much more important than CEO compensation levels. So check out this free list of interesting companies, that have HIGH return on equity and low debt.
We aim to bring you long-term focused research analysis driven by fundamental data. Note that our analysis may not factor in the latest price-sensitive company announcements or qualitative material.
If you spot an error that warrants correction, please contact the editor at editorial-team@simplywallst.com. This article by Simply Wall St is general in nature. It does not constitute a recommendation to buy or sell any stock, and does not take account of your objectives, or your financial situation. Simply Wall St has no position in the stocks mentioned. Thank you for reading.
