
 Yahoo Finance
 Interested In MDC Holdings Inc (NYSE:MDC)? Here’s How It Performed Recently

For investors, increase in profitability and industry-beating performance can be essential considerations in an investment. Below, I will examine MDC Holdings Inc’s (NYSE:MDC) track record on a high level, to give you some insight into how the company has been performing against its long term trend and its industry peers.
See our latest analysis for M.D.C. Holdings
Could MDC beat the long-term trend and outperform its industry?
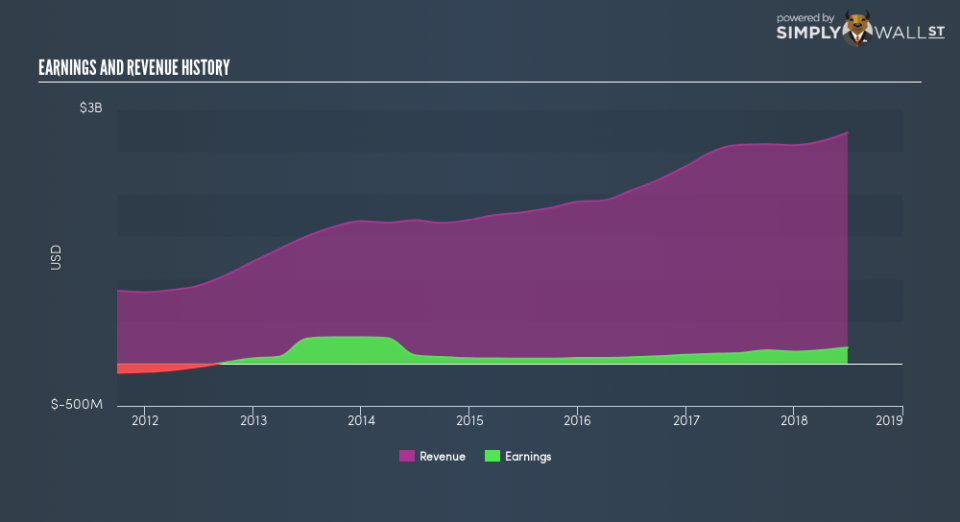
MDC’s trailing twelve-month earnings (from 30 June 2018) of US$187.4m has jumped 53.2% compared to the previous year. Furthermore, this one-year growth rate has exceeded its 5-year annual growth average of 15.8%, indicating the rate at which MDC is growing has accelerated. How has it been able to do this? Well, let’s take a look at whether it is merely owing to industry tailwinds, or if M.D.C. Holdings has seen some company-specific growth.
Over the past couple of years, M.D.C. Holdings increased its bottom line faster than revenue by successfully controlling its costs. This resulted in a margin expansion and profitability over time. Viewing growth from a sector-level, the US consumer durables industry has been growing its average earnings by double-digit 11.1% over the prior year, and 16.4% over the previous five years. This growth is a median of profitable companies of 25 Consumer Durables companies in US including China Energy Technology, Urbi Desarrollos Urbanos. de and Skyline Champion. This shows that whatever tailwind the industry is deriving benefit from, M.D.C. Holdings is capable of leveraging this to its advantage.
In terms of returns from investment, M.D.C. Holdings has fallen short of achieving a 20% return on equity (ROE), recording 12.6% instead. Furthermore, its return on assets (ROA) of 6.4% is below the US Consumer Durables industry of 6.5%, indicating M.D.C. Holdings’s are utilized less efficiently. However, its return on capital (ROC), which also accounts for M.D.C. Holdings’s debt level, has increased over the past 3 years from 5.1% to 8.9%. This correlates with a decrease in debt holding, with debt-to-equity ratio declining from 100% to 72.7% over the past 5 years.
What does this mean?
Though M.D.C. Holdings’s past data is helpful, it is only one aspect of my investment thesis. While M.D.C. Holdings has a good historical track record with positive growth and profitability, there’s no certainty that this will extrapolate into the future. I suggest you continue to research M.D.C. Holdings to get a better picture of the stock by looking at:
Future Outlook: What are well-informed industry analysts predicting for MDC’s future growth? Take a look at our free research report of analyst consensus for MDC’s outlook.
Financial Health: Are MDC’s operations financially sustainable? Balance sheets can be hard to analyze, which is why we’ve done it for you. Check out our financial health checks here.
Other High-Performing Stocks: Are there other stocks that provide better prospects with proven track records? Explore our free list of these great stocks here.
NB: Figures in this article are calculated using data from the trailing twelve months from 30 June 2018. This may not be consistent with full year annual report figures.
To help readers see past the short term volatility of the financial market, we aim to bring you a long-term focused research analysis purely driven by fundamental data. Note that our analysis does not factor in the latest price-sensitive company announcements.
The author is an independent contributor and at the time of publication had no position in the stocks mentioned. For errors that warrant correction please contact the editor at editorial-team@simplywallst.com.
