
 Yahoo Finance
 Instructure Holdings, Inc.'s (NYSE:INST) Price Is Out Of Tune With Revenues
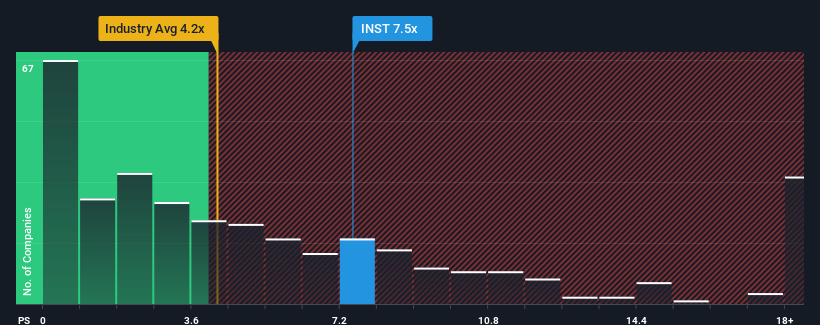
With a price-to-sales (or "P/S") ratio of 7.5x Instructure Holdings, Inc. (NYSE:INST) may be sending very bearish signals at the moment, given that almost half of all the Software companies in the United States have P/S ratios under 4.2x and even P/S lower than 1.8x are not unusual. Nonetheless, we'd need to dig a little deeper to determine if there is a rational basis for the highly elevated P/S.
See our latest analysis for Instructure Holdings
How Has Instructure Holdings Performed Recently?
Instructure Holdings' revenue growth of late has been pretty similar to most other companies. One possibility is that the P/S ratio is high because investors think this modest revenue performance will accelerate. However, if this isn't the case, investors might get caught out paying too much for the stock.
Want the full picture on analyst estimates for the company? Then our free report on Instructure Holdings will help you uncover what's on the horizon.
How Is Instructure Holdings' Revenue Growth Trending?
There's an inherent assumption that a company should far outperform the industry for P/S ratios like Instructure Holdings' to be considered reasonable.
Taking a look back first, we see that the company grew revenue by an impressive 15% last year. The latest three year period has also seen an excellent 81% overall rise in revenue, aided by its short-term performance. So we can start by confirming that the company has done a great job of growing revenue over that time.
Turning to the outlook, the next year should generate growth of 9.5% as estimated by the nine analysts watching the company. With the industry predicted to deliver 13% growth, the company is positioned for a weaker revenue result.
In light of this, it's alarming that Instructure Holdings' P/S sits above the majority of other companies. Apparently many investors in the company are way more bullish than analysts indicate and aren't willing to let go of their stock at any price. Only the boldest would assume these prices are sustainable as this level of revenue growth is likely to weigh heavily on the share price eventually.
The Key Takeaway
While the price-to-sales ratio shouldn't be the defining factor in whether you buy a stock or not, it's quite a capable barometer of revenue expectations.
It comes as a surprise to see Instructure Holdings trade at such a high P/S given the revenue forecasts look less than stellar. When we see a weak revenue outlook, we suspect the share price faces a much greater risk of declining, bringing back down the P/S figures. Unless these conditions improve markedly, it's very challenging to accept these prices as being reasonable.
It is also worth noting that we have found 2 warning signs for Instructure Holdings that you need to take into consideration.
It's important to make sure you look for a great company, not just the first idea you come across. So if growing profitability aligns with your idea of a great company, take a peek at this free list of interesting companies with strong recent earnings growth (and a low P/E).
Have feedback on this article? Concerned about the content? Get in touch with us directly. Alternatively, email editorial-team (at) simplywallst.com.
This article by Simply Wall St is general in nature. We provide commentary based on historical data and analyst forecasts only using an unbiased methodology and our articles are not intended to be financial advice. It does not constitute a recommendation to buy or sell any stock, and does not take account of your objectives, or your financial situation. We aim to bring you long-term focused analysis driven by fundamental data. Note that our analysis may not factor in the latest price-sensitive company announcements or qualitative material. Simply Wall St has no position in any stocks mentioned.
Join A Paid User Research Session
You’ll receive a US$30 Amazon Gift card for 1 hour of your time while helping us build better investing tools for the individual investors like yourself. Sign up here
