
 Yahoo Finance
 Should You Be Impressed By Rocky Mountain Liquor's (CVE:RUM) Returns on Capital?
If you're looking for a multi-bagger, there's a few things to keep an eye out for. Amongst other things, we'll want to see two things; firstly, a growing return on capital employed (ROCE) and secondly, an expansion in the company's amount of capital employed. This shows us that it's a compounding machine, able to continually reinvest its earnings back into the business and generate higher returns. In light of that, when we looked at Rocky Mountain Liquor (CVE:RUM) and its ROCE trend, we weren't exactly thrilled.
What is Return On Capital Employed (ROCE)?
For those that aren't sure what ROCE is, it measures the amount of pre-tax profits a company can generate from the capital employed in its business. The formula for this calculation on Rocky Mountain Liquor is:
Return on Capital Employed = Earnings Before Interest and Tax (EBIT) ÷ (Total Assets - Current Liabilities)
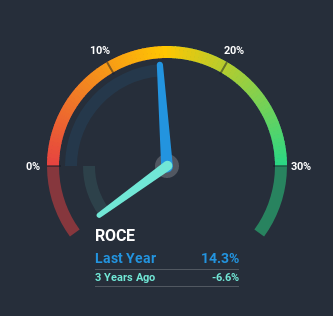
0.14 = CA$2.5m ÷ (CA$26m - CA$8.2m) (Based on the trailing twelve months to September 2020).
So, Rocky Mountain Liquor has an ROCE of 14%. On its own, that's a standard return, however it's much better than the 11% generated by the Consumer Retailing industry.
Check out our latest analysis for Rocky Mountain Liquor
While the past is not representative of the future, it can be helpful to know how a company has performed historically, which is why we have this chart above. If you'd like to look at how Rocky Mountain Liquor has performed in the past in other metrics, you can view this free graph of past earnings, revenue and cash flow.
The Trend Of ROCE
When we looked at the ROCE trend at Rocky Mountain Liquor, we didn't gain much confidence. To be more specific, ROCE has fallen from 18% over the last five years. Meanwhile, the business is utilizing more capital but this hasn't moved the needle much in terms of sales in the past 12 months, so this could reflect longer term investments. It's worth keeping an eye on the company's earnings from here on to see if these investments do end up contributing to the bottom line.
On a side note, Rocky Mountain Liquor has done well to pay down its current liabilities to 32% of total assets. That could partly explain why the ROCE has dropped. What's more, this can reduce some aspects of risk to the business because now the company's suppliers or short-term creditors are funding less of its operations. Since the business is basically funding more of its operations with it's own money, you could argue this has made the business less efficient at generating ROCE.
What We Can Learn From Rocky Mountain Liquor's ROCE
To conclude, we've found that Rocky Mountain Liquor is reinvesting in the business, but returns have been falling. And investors appear hesitant that the trends will pick up because the stock has fallen 43% in the last five years. On the whole, we aren't too inspired by the underlying trends and we think there may be better chances of finding a multi-bagger elsewhere.
Rocky Mountain Liquor does have some risks, we noticed 4 warning signs (and 2 which can't be ignored) we think you should know about.
For those who like to invest in solid companies, check out this free list of companies with solid balance sheets and high returns on equity.
This article by Simply Wall St is general in nature. It does not constitute a recommendation to buy or sell any stock, and does not take account of your objectives, or your financial situation. We aim to bring you long-term focused analysis driven by fundamental data. Note that our analysis may not factor in the latest price-sensitive company announcements or qualitative material. Simply Wall St has no position in any stocks mentioned.
Have feedback on this article? Concerned about the content? Get in touch with us directly. Alternatively, email editorial-team (at) simplywallst.com.
