
 Yahoo Finance
 Imperial Metals (TSE:III) shareholders have earned a 20% CAGR over the last three years
By buying an index fund, investors can approximate the average market return. But if you pick the right individual stocks, you could make more than that. For example, the Imperial Metals Corporation (TSE:III) share price is up 72% in the last three years, clearly besting the market return of around 28% (not including dividends).
So let's investigate and see if the longer term performance of the company has been in line with the underlying business' progress.
View our latest analysis for Imperial Metals
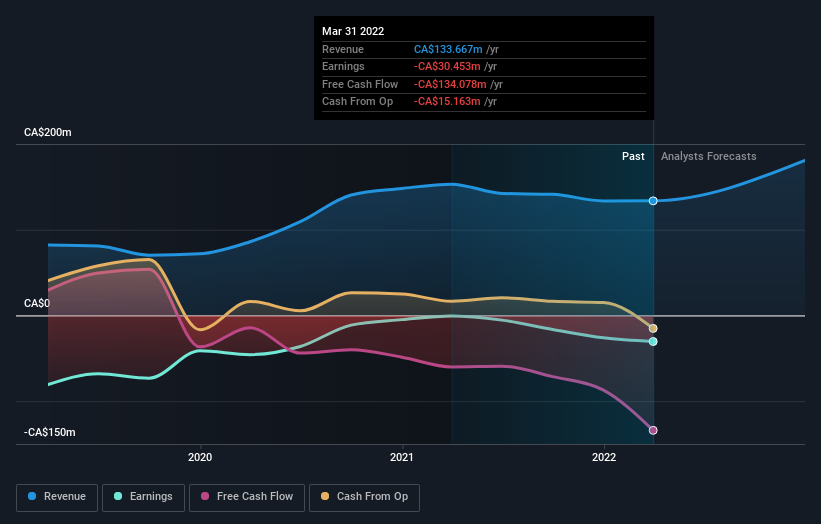
Given that Imperial Metals didn't make a profit in the last twelve months, we'll focus on revenue growth to form a quick view of its business development. Shareholders of unprofitable companies usually expect strong revenue growth. Some companies are willing to postpone profitability to grow revenue faster, but in that case one does expect good top-line growth.
In the last 3 years Imperial Metals saw its revenue grow at 24% per year. That's well above most pre-profit companies. The share price rise of 20% per year throughout that time is nice to see, and given the revenue growth, that gain seems somewhat justified. If that's the case, now might be the time to take a close look at Imperial Metals. A window of opportunity may reveal itself with time, if the business can trend to profitability.
The company's revenue and earnings (over time) are depicted in the image below (click to see the exact numbers).
It's probably worth noting that the CEO is paid less than the median at similar sized companies. But while CEO remuneration is always worth checking, the really important question is whether the company can grow earnings going forward. You can see what analysts are predicting for Imperial Metals in this interactive graph of future profit estimates.
A Different Perspective
Investors in Imperial Metals had a tough year, with a total loss of 32%, against a market gain of about 9.5%. Even the share prices of good stocks drop sometimes, but we want to see improvements in the fundamental metrics of a business, before getting too interested. Regrettably, last year's performance caps off a bad run, with the shareholders facing a total loss of 5% per year over five years. We realise that Baron Rothschild has said investors should "buy when there is blood on the streets", but we caution that investors should first be sure they are buying a high quality business. It's always interesting to track share price performance over the longer term. But to understand Imperial Metals better, we need to consider many other factors. Even so, be aware that Imperial Metals is showing 3 warning signs in our investment analysis , and 2 of those are concerning...
Of course Imperial Metals may not be the best stock to buy. So you may wish to see this free collection of growth stocks.
Please note, the market returns quoted in this article reflect the market weighted average returns of stocks that currently trade on CA exchanges.
Have feedback on this article? Concerned about the content? Get in touch with us directly. Alternatively, email editorial-team (at) simplywallst.com.
This article by Simply Wall St is general in nature. We provide commentary based on historical data and analyst forecasts only using an unbiased methodology and our articles are not intended to be financial advice. It does not constitute a recommendation to buy or sell any stock, and does not take account of your objectives, or your financial situation. We aim to bring you long-term focused analysis driven by fundamental data. Note that our analysis may not factor in the latest price-sensitive company announcements or qualitative material. Simply Wall St has no position in any stocks mentioned.
