
 Yahoo Finance
 Can You Imagine How Healthcare Trust of America's (NYSE:HTA) Shareholders Feel About The 11% Share Price Increase?
Buying a low-cost index fund will get you the average market return. But across the board there are plenty of stocks that underperform the market. Unfortunately for shareholders, while the Healthcare Trust of America, Inc. (NYSE:HTA) share price is up 11% in the last three years, that falls short of the market return. In the last year the stock price gained, albeit only 4.0%.
View our latest analysis for Healthcare Trust of America
There is no denying that markets are sometimes efficient, but prices do not always reflect underlying business performance. One flawed but reasonable way to assess how sentiment around a company has changed is to compare the earnings per share (EPS) with the share price.
Over the last three years, Healthcare Trust of America failed to grow earnings per share, which fell 5.3% (annualized).
The strong decline in earnings per share suggests the market isn't using EPS to judge the company. Since the change in EPS doesn't seem to correlate with the change in share price, it's worth taking a look at other metrics.
Interestingly, the dividend has increased over time; so that may have given the share price a boost. Sometimes yield-chasing investors will flock to a company if they think the dividend can grow over time.
The company's revenue and earnings (over time) are depicted in the image below (click to see the exact numbers).
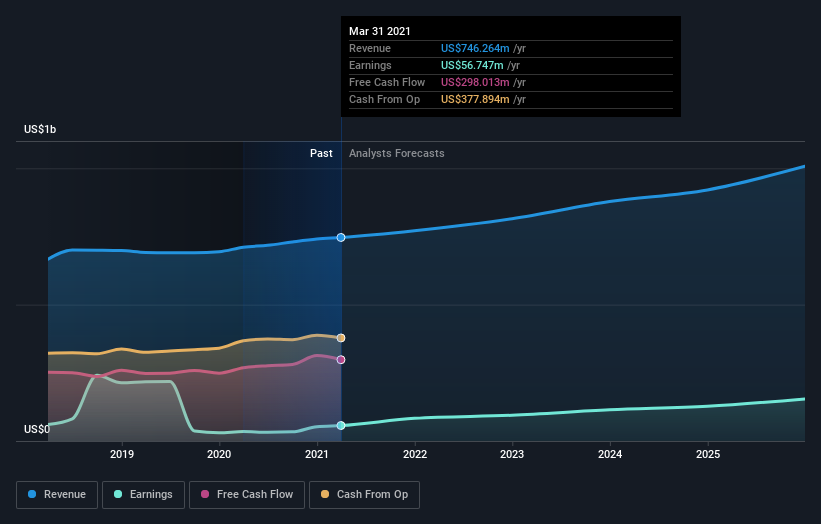
We know that Healthcare Trust of America has improved its bottom line lately, but what does the future have in store? This free report showing analyst forecasts should help you form a view on Healthcare Trust of America
What About Dividends?
It is important to consider the total shareholder return, as well as the share price return, for any given stock. The TSR is a return calculation that accounts for the value of cash dividends (assuming that any dividend received was reinvested) and the calculated value of any discounted capital raisings and spin-offs. It's fair to say that the TSR gives a more complete picture for stocks that pay a dividend. In the case of Healthcare Trust of America, it has a TSR of 28% for the last 3 years. That exceeds its share price return that we previously mentioned. And there's no prize for guessing that the dividend payments largely explain the divergence!
A Different Perspective
Healthcare Trust of America shareholders are up 9.0% for the year (even including dividends). But that was short of the market average. On the bright side, that's still a gain, and it's actually better than the average return of 2% over half a decade This could indicate that the company is winning over new investors, as it pursues its strategy. It's always interesting to track share price performance over the longer term. But to understand Healthcare Trust of America better, we need to consider many other factors. For example, we've discovered 3 warning signs for Healthcare Trust of America (1 shouldn't be ignored!) that you should be aware of before investing here.
If you like to buy stocks alongside management, then you might just love this free list of companies. (Hint: insiders have been buying them).
Please note, the market returns quoted in this article reflect the market weighted average returns of stocks that currently trade on US exchanges.
This article by Simply Wall St is general in nature. It does not constitute a recommendation to buy or sell any stock, and does not take account of your objectives, or your financial situation. We aim to bring you long-term focused analysis driven by fundamental data. Note that our analysis may not factor in the latest price-sensitive company announcements or qualitative material. Simply Wall St has no position in any stocks mentioned.
Have feedback on this article? Concerned about the content? Get in touch with us directly. Alternatively, email editorial-team (at) simplywallst.com.
