
 Yahoo Finance
 Are Hudbay Minerals Inc.'s (TSE:HBM) Mixed Financials Driving The Negative Sentiment?
Hudbay Minerals (TSE:HBM) has had a rough three months with its share price down 12%. We, however decided to study the company's financials to determine if they have got anything to do with the price decline. Long-term fundamentals are usually what drive market outcomes, so it's worth paying close attention. In this article, we decided to focus on Hudbay Minerals' ROE.
Return on Equity or ROE is a test of how effectively a company is growing its value and managing investors’ money. In other words, it is a profitability ratio which measures the rate of return on the capital provided by the company's shareholders.
View our latest analysis for Hudbay Minerals
How Do You Calculate Return On Equity?
The formula for return on equity is:
Return on Equity = Net Profit (from continuing operations) ÷ Shareholders' Equity
So, based on the above formula, the ROE for Hudbay Minerals is:
4.5% = US$70m ÷ US$1.6b (Based on the trailing twelve months to December 2022).
The 'return' refers to a company's earnings over the last year. One way to conceptualize this is that for each CA$1 of shareholders' capital it has, the company made CA$0.04 in profit.
What Is The Relationship Between ROE And Earnings Growth?
Thus far, we have learned that ROE measures how efficiently a company is generating its profits. We now need to evaluate how much profit the company reinvests or "retains" for future growth which then gives us an idea about the growth potential of the company. Assuming all else is equal, companies that have both a higher return on equity and higher profit retention are usually the ones that have a higher growth rate when compared to companies that don't have the same features.
Hudbay Minerals' Earnings Growth And 4.5% ROE
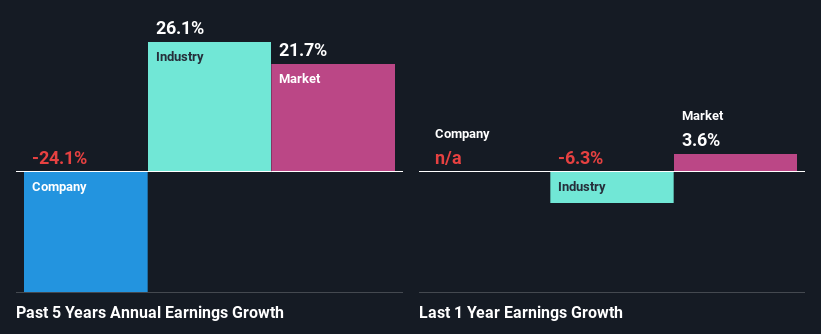
When you first look at it, Hudbay Minerals' ROE doesn't look that attractive. A quick further study shows that the company's ROE doesn't compare favorably to the industry average of 11% either. Given the circumstances, the significant decline in net income by 24% seen by Hudbay Minerals over the last five years is not surprising. We believe that there also might be other aspects that are negatively influencing the company's earnings prospects. For example, it is possible that the business has allocated capital poorly or that the company has a very high payout ratio.
So, as a next step, we compared Hudbay Minerals' performance against the industry and were disappointed to discover that while the company has been shrinking its earnings, the industry has been growing its earnings at a rate of 26% in the same period.
The basis for attaching value to a company is, to a great extent, tied to its earnings growth. What investors need to determine next is if the expected earnings growth, or the lack of it, is already built into the share price. Doing so will help them establish if the stock's future looks promising or ominous. One good indicator of expected earnings growth is the P/E ratio which determines the price the market is willing to pay for a stock based on its earnings prospects. So, you may want to check if Hudbay Minerals is trading on a high P/E or a low P/E, relative to its industry.
Is Hudbay Minerals Efficiently Re-investing Its Profits?
Hudbay Minerals' low LTM (or last twelve month) payout ratio of 5.5% (or a retention ratio of 95%) over the last three years should mean that the company is retaining most of its earnings to fuel its growth but the company's earnings have actually shrunk. The low payout should mean that the company is retaining most of its earnings and consequently, should see some growth. It looks like there might be some other reasons to explain the lack in that respect. For example, the business could be in decline.
Moreover, Hudbay Minerals has been paying dividends for at least ten years or more suggesting that management must have perceived that the shareholders prefer dividends over earnings growth. Our latest analyst data shows that the future payout ratio of the company is expected to drop to 4.1% over the next three years. Accordingly, the expected drop in the payout ratio explains the expected increase in the company's ROE to 5.8%, over the same period.
Summary
Overall, we have mixed feelings about Hudbay Minerals. Even though it appears to be retaining most of its profits, given the low ROE, investors may not be benefitting from all that reinvestment after all. The low earnings growth suggests our theory correct. With that said, we studied the latest analyst forecasts and found that while the company has shrunk its earnings in the past, analysts expect its earnings to grow in the future. To know more about the latest analysts predictions for the company, check out this visualization of analyst forecasts for the company.
Have feedback on this article? Concerned about the content? Get in touch with us directly. Alternatively, email editorial-team (at) simplywallst.com.
This article by Simply Wall St is general in nature. We provide commentary based on historical data and analyst forecasts only using an unbiased methodology and our articles are not intended to be financial advice. It does not constitute a recommendation to buy or sell any stock, and does not take account of your objectives, or your financial situation. We aim to bring you long-term focused analysis driven by fundamental data. Note that our analysis may not factor in the latest price-sensitive company announcements or qualitative material. Simply Wall St has no position in any stocks mentioned.
Join A Paid User Research Session
You’ll receive a US$30 Amazon Gift card for 1 hour of your time while helping us build better investing tools for the individual investors like yourself. Sign up here
