
 Yahoo Finance
 Howmet (HWM) Q2 Earnings & Revenues Beat Estimates, Rise Y/Y

Howmet Aerospace Inc. HWM reported better-than-expected second-quarter 2022 results. HWM’s earnings surpassed the Zacks Consensus Estimate by 6.1% and sales beat the same by 2%.
Earnings, excluding special items, were 35 cents per share in the reported quarter, surpassing the Zacks Consensus Estimate of 33 cents. Earnings increased 59.1% from the year-ago quarter’s 22 cents per share, driven by higher revenues. Quarterly earnings exceeded management’s projection of 31-33 cents.
On a sequential basis, Howmet’s bottom line increased 12.9% from 31 cents.
Revenue Details
In the quarter under review, Howmet’s net sales were $1,393 million, reflecting a 17% increase from the year-ago quarter’s number. The increase was backed by an improved commercial aerospace market and its pricing actions. Howmet’s top line beat the Zacks Consensus Estimate of $1,300 million and management’s projection of $1.28-$1.32 billion. On a sequential basis, HWM’s revenues increased 3%.
Howmet reports revenues under four segments. A brief discussion on the quarterly results is provided below.
Engine Products’ revenues totaled $652 million, representing 46.8% of net revenues in the quarter under review. On a year-over-year basis, the segment’s revenues increased 20%, driven by strength in the commercial aerospace, and oil and gas volume.
The Fastening Systems segment generated revenues of $277 million, accounting for 19.9% of net revenues in the reported quarter. Revenues increased 6% year over year, driven by strength in the commercial aerospace, partially offset by a poor performance in the industrial market and a decline in Boeing 787 production.
The Engineered Structures segment’s revenues, representing 13.3% of net revenues, increased 16% year over year to $185 million. The results benefited from gains in the commercial aerospace market, partially offset by a decline in Boeing 787 production.
Forged Wheels revenues totaled $279 million, representing 20% of net revenues in the quarter under review. On a year-over-year basis, the segment’s revenues increased 22%, driven by an expanded volume, partially offset by an unfavorable forex movement.
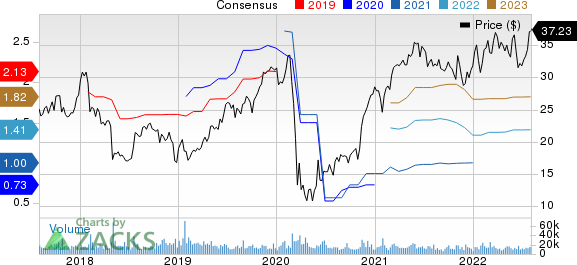
Howmet Aerospace Inc. Price and Consensus
Howmet Aerospace Inc. price-consensus-chart | Howmet Aerospace Inc. Quote
Margin Profile
In the reported quarter, Howmet’s cost of goods sold increased 15.2% year over year to $987 million. It represented 70.9% of the reported quarter’s net sales compared with 71.7% in the year-ago quarter.
Selling, general, administrative and other expenses increased 50.9% year over year to $83 million. The metric represented 6% of net sales in the reported quarter compared with 4.6% in the year-ago quarter. Research and development expenses were $9 million in the quarter.
Adjusted earnings before interest, taxes, depreciation and amortization (EBITDA), excluding special items, in the reported quarter were $317 million, while adjusted EBITDA margin was 22.8%. Operating profits increased 16.4% year over year to $241 million, whereas margin of 17.3% was in line with the year-ago reported figure.
Net interest expenses in the quarter totaled $57 million, down 13.6% from the year-ago quarter’s figure. The adjusted tax rate in the reported quarter was 23.2%.
Balance Sheet and Cash Flow
At the time of exiting the second quarter of 2022, Howmet had cash and cash equivalents of $537 million, decreasing 25.1% from $720 million recorded in the fourth quarter of 2021. Long-term debt was $4,169 million, down 1.4% from $4,227 million reported in the fourth quarter of 2021.
In the first six months, Howmet generated net cash of $213 million from its operating activities compared with $79 million generated in the year-ago period. Capital spending totaled $106 million compared with $91 million a year ago. Free cash flow was $107 million in the quarter.
Howmet paid out dividends of $18 million in the first six months compared with $1 million in the year-ago period. Also, it repurchased shares worth $235 million in the first six months compared with a $200-million buyback made a year ago.
Outlook
For 2022, Howmet anticipates revenues of $5.64-$5.71 billion. The midpoint is currently pegged at $5.68 billion. Earnings (excluding special items) are expected to be $1.38-$1.42, with the midpoint at $1.41.
Adjusted EBITDA is expected to be $1.276-$1.299 billion for the year, with the mid-point of $1.29 billion. The EBITDA margin is projected at 22.6-22.7%, the midpoint being 22.7%. Free cash flow is predicted to be $625-$675 million, with a midpoint of $650 million.
For the third quarter, Howmet anticipates revenues of $1.425-$1.455 billion, with a mid-point of $1.44 billion. Earnings (excluding special items) are expected to be 35-37 cents (the midpoint being 36 cents), while adjusted EBITDA is predicted to be $320-$331 million (the midpoint being $326 million).
Zacks Rank & Stocks to Consider
Howmet currently carries a Zacks Rank #4 (Sell).
Some better-ranked companies are discussed below:
Quanex Building Products Corporation NX presently sports a Zacks Rank #1 (Strong Buy). NX delivered a trailing four-quarter earnings surprise of 30.2%, on average. You can see the complete list of today’s Zacks #1 Rank stocks here.
NX’s earnings estimates have increased 21.8% for fiscal 2022 (ending October 2022) in the past 60 days. Its shares have rallied 11.7% in the past six months.
Titan International, Inc. TWI presently flaunts a Zacks Rank of 1. Its earnings surprise in the last four quarters was 47%, on average.
In the past 60 days, TWI’s earnings estimates have increased 43.3% for 2022. The stock has surged 46.4% in the past six months.
Valmont Industries, Inc. VMI presently has a Zacks Rank #2 (Buy). VMI’s earnings surprise in the last four quarters was 13.7%, on average.
In the past 60 days, Valmont’s earnings estimates have increased 3.8% for 2022. The stock has rallied 29% in the past six months.
Want the latest recommendations from Zacks Investment Research? Today, you can download 7 Best Stocks for the Next 30 Days. Click to get this free report
Valmont Industries, Inc. (VMI) : Free Stock Analysis Report
Quanex Building Products Corporation (NX) : Free Stock Analysis Report
Titan International, Inc. (TWI) : Free Stock Analysis Report
Howmet Aerospace Inc. (HWM) : Free Stock Analysis Report
To read this article on Zacks.com click here.
Zacks Investment Research
