
 Yahoo Finance
 Here's Why We're Watching Evrim Resources's (CVE:EVM) Cash Burn Situation

We can readily understand why investors are attracted to unprofitable companies. For example, although Amazon.com made losses for many years after listing, if you had bought and held the shares since 1999, you would have made a fortune. Having said that, unprofitable companies are risky because they could potentially burn through all their cash and become distressed.
So should Evrim Resources (CVE:EVM) shareholders be worried about its cash burn? For the purposes of this article, cash burn is the annual rate at which an unprofitable company spends cash to fund its growth; its negative free cash flow. The first step is to compare its cash burn with its cash reserves, to give us its 'cash runway'.
See our latest analysis for Evrim Resources
How Long Is Evrim Resources's Cash Runway?
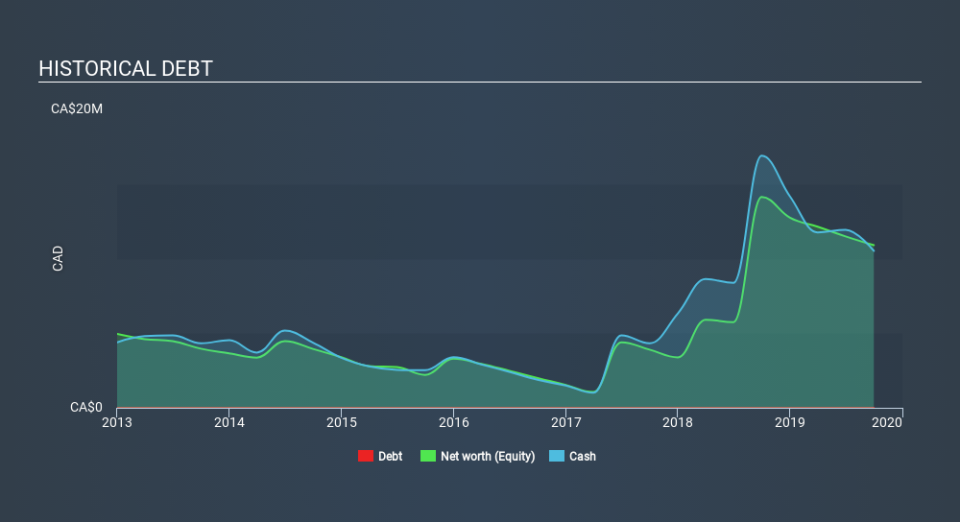
You can calculate a company's cash runway by dividing the amount of cash it has by the rate at which it is spending that cash. As at September 2019, Evrim Resources had cash of CA$11m and such minimal debt that we can ignore it for the purposes of this analysis. In the last year, its cash burn was CA$6.3m. That means it had a cash runway of around 20 months as of September 2019. That's not too bad, but it's fair to say the end of the cash runway is in sight, unless cash burn reduces drastically. The image below shows how its cash balance has been changing over the last few years.
Can Evrim Resources Raise More Cash Easily?
Issuing new shares, or taking on debt, are the most common ways for a listed company to raise more money for its business. One of the main advantages held by publicly listed companies is that they can sell shares to investors to raise cash to fund growth. By comparing a company's annual cash burn to its total market capitalisation, we can estimate roughly how many shares it would have to issue in order to run the company for another year (at the same burn rate).
Evrim Resources has a market capitalisation of CA$25m and burnt through CA$6.3m last year, which is 26% of the company's market value. That's fairly notable cash burn, so if the company had to sell shares to cover the cost of another year's operations, shareholders would suffer some costly dilution.
How Risky Is Evrim Resources's Cash Burn Situation?
Because Evrim Resources is an early stage company, we don't have a great deal of data on which to form an opinion of its cash burn. And it is worth keeping in mind that early stage companies are generally more risky than well established ones. Even though we don't think shareholders should be alarmed by its cash burn, we do think they should be keeping a close eye on it. We think it's very important to consider the cash burn for loss making companies, but other considerations such as the amount the CEO is paid can also enhance your understanding of the business. You can click here to see what Evrim Resources's CEO gets paid each year.
Of course, you might find a fantastic investment by looking elsewhere. So take a peek at this free list of interesting companies, and this list of stocks growth stocks (according to analyst forecasts)
If you spot an error that warrants correction, please contact the editor at editorial-team@simplywallst.com. This article by Simply Wall St is general in nature. It does not constitute a recommendation to buy or sell any stock, and does not take account of your objectives, or your financial situation. Simply Wall St has no position in the stocks mentioned.
We aim to bring you long-term focused research analysis driven by fundamental data. Note that our analysis may not factor in the latest price-sensitive company announcements or qualitative material. Thank you for reading.
