
 Yahoo Finance
 Here's Why Apergy (NYSE:APY) Can Manage Its Debt Responsibly

Legendary fund manager Li Lu (who Charlie Munger backed) once said, 'The biggest investment risk is not the volatility of prices, but whether you will suffer a permanent loss of capital.' It's only natural to consider a company's balance sheet when you examine how risky it is, since debt is often involved when a business collapses. We note that Apergy Corporation (NYSE:APY) does have debt on its balance sheet. But the more important question is: how much risk is that debt creating?
When Is Debt A Problem?
Debt is a tool to help businesses grow, but if a business is incapable of paying off its lenders, then it exists at their mercy. In the worst case scenario, a company can go bankrupt if it cannot pay its creditors. However, a more frequent (but still costly) occurrence is where a company must issue shares at bargain-basement prices, permanently diluting shareholders, just to shore up its balance sheet. Having said that, the most common situation is where a company manages its debt reasonably well - and to its own advantage. The first step when considering a company's debt levels is to consider its cash and debt together.
See our latest analysis for Apergy
How Much Debt Does Apergy Carry?
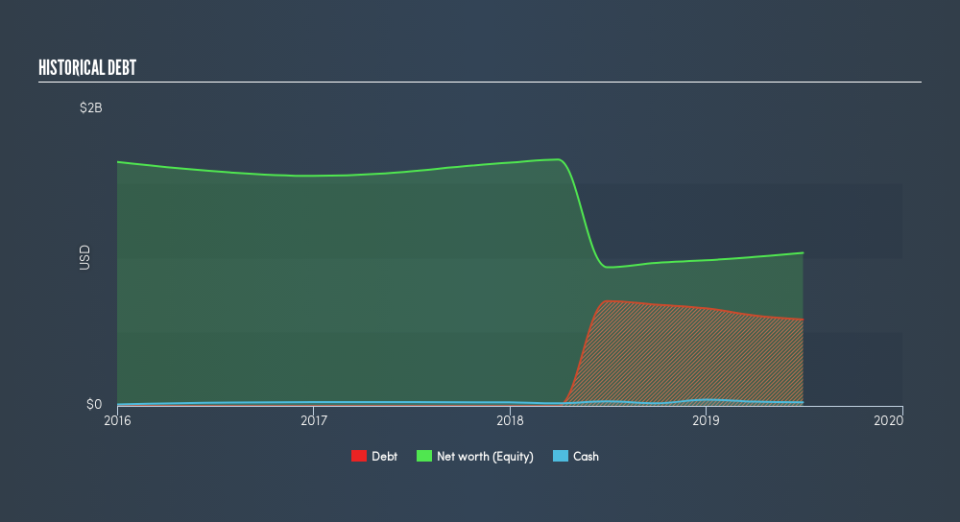
The image below, which you can click on for greater detail, shows that Apergy had debt of US$617.7m at the end of June 2019, a reduction from US$707.3m over a year. On the flip side, it has US$24.3m in cash leading to net debt of about US$593.4m.
How Healthy Is Apergy's Balance Sheet?
We can see from the most recent balance sheet that Apergy had liabilities of US$201.1m falling due within a year, and liabilities of US$742.6m due beyond that. Offsetting this, it had US$24.3m in cash and US$256.4m in receivables that were due within 12 months. So it has liabilities totalling US$663.0m more than its cash and near-term receivables, combined.
This deficit isn't so bad because Apergy is worth US$2.43b, and thus could probably raise enough capital to shore up its balance sheet, if the need arose. But we definitely want to keep our eyes open to indications that its debt is bringing too much risk.
We use two main ratios to inform us about debt levels relative to earnings. The first is net debt divided by earnings before interest, tax, depreciation, and amortization (EBITDA), while the second is how many times its earnings before interest and tax (EBIT) covers its interest expense (or its interest cover, for short). This way, we consider both the absolute quantum of the debt, as well as the interest rates paid on it.
Apergy has net debt worth 1.9 times EBITDA, which isn't too much, but its interest cover looks a bit on the low side, with EBIT at only 4.4 times the interest expense. While these numbers do not alarm us, it's worth noting that the cost of the company's debt is having a real impact. It is well worth noting that Apergy's EBIT shot up like bamboo after rain, gaining 45% in the last twelve months. That'll make it easier to manage its debt. There's no doubt that we learn most about debt from the balance sheet. But it is future earnings, more than anything, that will determine Apergy's ability to maintain a healthy balance sheet going forward. So if you're focused on the future you can check out this free report showing analyst profit forecasts.
Finally, a company can only pay off debt with cold hard cash, not accounting profits. So we always check how much of that EBIT is translated into free cash flow. Over the most recent three years, Apergy recorded free cash flow worth 66% of its EBIT, which is around normal, given free cash flow excludes interest and tax. This cold hard cash means it can reduce its debt when it wants to.
Our View
Happily, Apergy's impressive EBIT growth rate implies it has the upper hand on its debt. But, on a more sombre note, we are a little concerned by its interest cover. Taking all this data into account, it seems to us that Apergy takes a pretty sensible approach to debt. While that brings some risk, it can also enhance returns for shareholders. Above most other metrics, we think its important to track how fast earnings per share is growing, if at all. If you've also come to that realization, you're in luck, because today you can view this interactive graph of Apergy's earnings per share history for free.
When all is said and done, sometimes its easier to focus on companies that don't even need debt. Readers can access a list of growth stocks with zero net debt 100% free, right now.
We aim to bring you long-term focused research analysis driven by fundamental data. Note that our analysis may not factor in the latest price-sensitive company announcements or qualitative material.
If you spot an error that warrants correction, please contact the editor at editorial-team@simplywallst.com. This article by Simply Wall St is general in nature. It does not constitute a recommendation to buy or sell any stock, and does not take account of your objectives, or your financial situation. Simply Wall St has no position in the stocks mentioned. Thank you for reading.
