
 Yahoo Finance
 Here's What's Concerning About Textron's (NYSE:TXT) Returns On Capital
What financial metrics can indicate to us that a company is maturing or even in decline? Typically, we'll see the trend of both return on capital employed (ROCE) declining and this usually coincides with a decreasing amount of capital employed. Basically the company is earning less on its investments and it is also reducing its total assets. So after glancing at the trends within Textron (NYSE:TXT), we weren't too hopeful.
What is Return On Capital Employed (ROCE)?
Just to clarify if you're unsure, ROCE is a metric for evaluating how much pre-tax income (in percentage terms) a company earns on the capital invested in its business. Analysts use this formula to calculate it for Textron:
Return on Capital Employed = Earnings Before Interest and Tax (EBIT) ÷ (Total Assets - Current Liabilities)
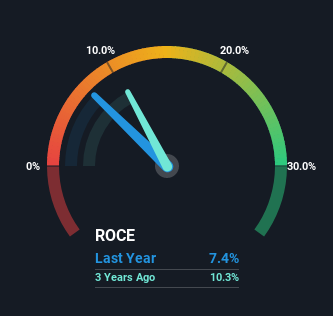
0.074 = US$925m ÷ (US$16b - US$3.3b) (Based on the trailing twelve months to April 2022).
Thus, Textron has an ROCE of 7.4%. In absolute terms, that's a low return but it's around the Aerospace & Defense industry average of 8.5%.
Check out our latest analysis for Textron
Above you can see how the current ROCE for Textron compares to its prior returns on capital, but there's only so much you can tell from the past. If you'd like to see what analysts are forecasting going forward, you should check out our free report for Textron.
So How Is Textron's ROCE Trending?
There is reason to be cautious about Textron, given the returns are trending downwards. Unfortunately the returns on capital have diminished from the 9.2% that they were earning five years ago. On top of that, it's worth noting that the amount of capital employed within the business has remained relatively steady. Companies that exhibit these attributes tend to not be shrinking, but they can be mature and facing pressure on their margins from competition. So because these trends aren't typically conducive to creating a multi-bagger, we wouldn't hold our breath on Textron becoming one if things continue as they have.
The Key Takeaway
In summary, it's unfortunate that Textron is generating lower returns from the same amount of capital. Investors must expect better things on the horizon though because the stock has risen 36% in the last five years. Either way, we aren't huge fans of the current trends and so with that we think you might find better investments elsewhere.
While Textron doesn't shine too bright in this respect, it's still worth seeing if the company is trading at attractive prices. You can find that out with our FREE intrinsic value estimation on our platform.
While Textron may not currently earn the highest returns, we've compiled a list of companies that currently earn more than 25% return on equity. Check out this free list here.
Have feedback on this article? Concerned about the content? Get in touch with us directly. Alternatively, email editorial-team (at) simplywallst.com.
This article by Simply Wall St is general in nature. We provide commentary based on historical data and analyst forecasts only using an unbiased methodology and our articles are not intended to be financial advice. It does not constitute a recommendation to buy or sell any stock, and does not take account of your objectives, or your financial situation. We aim to bring you long-term focused analysis driven by fundamental data. Note that our analysis may not factor in the latest price-sensitive company announcements or qualitative material. Simply Wall St has no position in any stocks mentioned.
