
 Yahoo Finance
 Here's What We Think About NexgenRx Inc.'s (CVE:NXG) CEO Pay

In 2003 Ron Loucks was appointed CEO of NexgenRx Inc. (CVE:NXG). This analysis aims first to contrast CEO compensation with other companies that have similar market capitalization. Then we'll look at a snap shot of the business growth. Third, we'll reflect on the total return to shareholders over three years, as a second measure of business performance. This process should give us an idea about how appropriately the CEO is paid.
Check out our latest analysis for NexgenRx
How Does Ron Loucks's Compensation Compare With Similar Sized Companies?
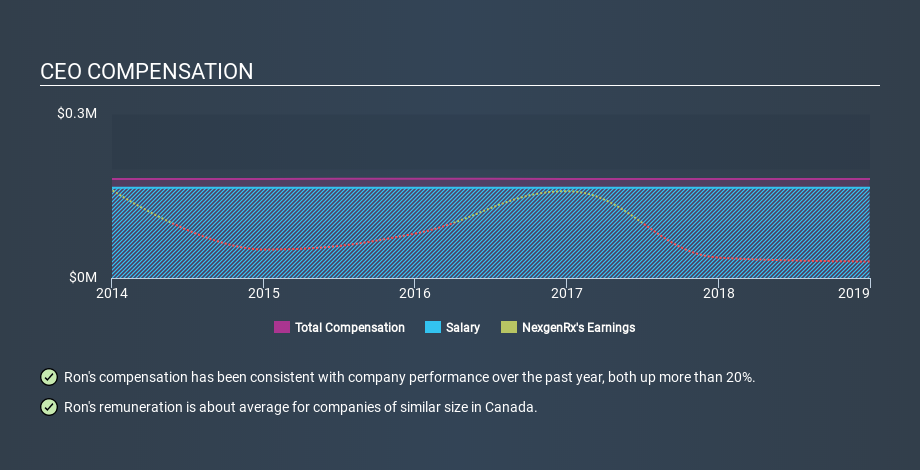
At the time of writing, our data says that NexgenRx Inc. has a market cap of CA$13m, and reported total annual CEO compensation of CA$181k for the year to December 2018. While we always look at total compensation first, we note that the salary component is less, at CA$165k. We looked at a group of companies with market capitalizations under CA$265m, and the median CEO total compensation was CA$212k.
That means Ron Loucks receives fairly typical remuneration for the CEO of a company that size. While this data point isn't particularly informative alone, it gains more meaning when considered with business performance.
You can see, below, how CEO compensation at NexgenRx has changed over time.
Is NexgenRx Inc. Growing?
Over the last three years NexgenRx Inc. has shrunk its earnings per share by an average of 58% per year (measured with a line of best fit). Its revenue is up 58% over last year.
Investors should note that, over three years, earnings per share are down. But in contrast the revenue growth is strong, suggesting future potential for earnings growth. It's hard to reach a conclusion about business performance right now. This may be one to watch. We don't have analyst forecasts, but you might want to assess this data-rich visualization of earnings, revenue and cash flow.
Has NexgenRx Inc. Been A Good Investment?
Since shareholders would have lost about 27% over three years, some NexgenRx Inc. shareholders would surely be feeling negative emotions. It therefore might be upsetting for shareholders if the CEO were paid generously.
In Summary...
Remuneration for Ron Loucks is close enough to the median pay for a CEO of a similar sized company .
The company cannot boast particularly strong per share growth. And shareholder returns have been disappointing over the last three years. So many would argue that the CEO is certainly not underpaid. CEO compensation is one thing, but it is also interesting to check if the CEO is buying or selling NexgenRx (free visualization of insider trades).
Arguably, business quality is much more important than CEO compensation levels. So check out this free list of interesting companies, that have HIGH return on equity and low debt.
If you spot an error that warrants correction, please contact the editor at editorial-team@simplywallst.com. This article by Simply Wall St is general in nature. It does not constitute a recommendation to buy or sell any stock, and does not take account of your objectives, or your financial situation. Simply Wall St has no position in the stocks mentioned.
We aim to bring you long-term focused research analysis driven by fundamental data. Note that our analysis may not factor in the latest price-sensitive company announcements or qualitative material. Thank you for reading.
