
 Yahoo Finance
 Here's What The Southern Company's (NYSE:SO) P/E Ratio Is Telling Us

This article is for investors who would like to improve their understanding of price to earnings ratios (P/E ratios). We'll look at The Southern Company's (NYSE:SO) P/E ratio and reflect on what it tells us about the company's share price. What is Southern's P/E ratio? Well, based on the last twelve months it is 14.76. In other words, at today's prices, investors are paying $14.76 for every $1 in prior year profit.
Check out our latest analysis for Southern
How Do You Calculate Southern's P/E Ratio?
The formula for price to earnings is:
Price to Earnings Ratio = Share Price ÷ Earnings per Share (EPS)
Or for Southern:
P/E of 14.76 = USD64.92 ÷ USD4.40 (Based on the year to September 2019.)
Is A High P/E Ratio Good?
A higher P/E ratio means that buyers have to pay a higher price for each USD1 the company has earned over the last year. That isn't a good or a bad thing on its own, but a high P/E means that buyers have a higher opinion of the business's prospects, relative to stocks with a lower P/E.
Does Southern Have A Relatively High Or Low P/E For Its Industry?
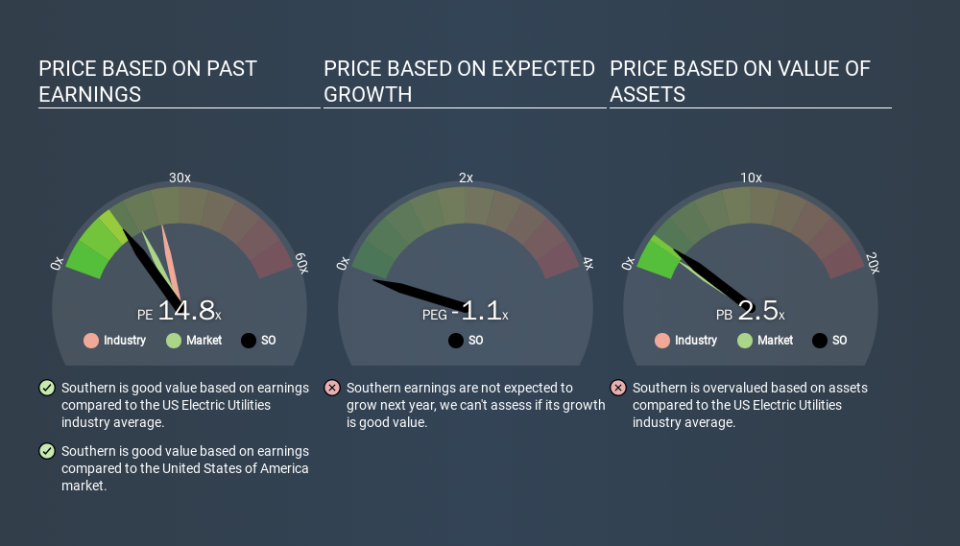
One good way to get a quick read on what market participants expect of a company is to look at its P/E ratio. If you look at the image below, you can see Southern has a lower P/E than the average (25.0) in the electric utilities industry classification.
Southern's P/E tells us that market participants think it will not fare as well as its peers in the same industry. Since the market seems unimpressed with Southern, it's quite possible it could surprise on the upside. If you consider the stock interesting, further research is recommended. For example, I often monitor director buying and selling.
How Growth Rates Impact P/E Ratios
Probably the most important factor in determining what P/E a company trades on is the earnings growth. If earnings are growing quickly, then the 'E' in the equation will increase faster than it would otherwise. That means unless the share price increases, the P/E will reduce in a few years. So while a stock may look expensive based on past earnings, it could be cheap based on future earnings.
In the last year, Southern grew EPS like Taylor Swift grew her fan base back in 2010; the 83% gain was both fast and well deserved. Even better, EPS is up 18% per year over three years. So we'd absolutely expect it to have a relatively high P/E ratio.
Don't Forget: The P/E Does Not Account For Debt or Bank Deposits
One drawback of using a P/E ratio is that it considers market capitalization, but not the balance sheet. In other words, it does not consider any debt or cash that the company may have on the balance sheet. Theoretically, a business can improve its earnings (and produce a lower P/E in the future) by investing in growth. That means taking on debt (or spending its cash).
Such expenditure might be good or bad, in the long term, but the point here is that the balance sheet is not reflected by this ratio.
How Does Southern's Debt Impact Its P/E Ratio?
Net debt totals 63% of Southern's market cap. This is a reasonably significant level of debt -- all else being equal you'd expect a much lower P/E than if it had net cash.
The Bottom Line On Southern's P/E Ratio
Southern's P/E is 14.8 which is below average (18.9) in the US market. The company may have significant debt, but EPS growth was good last year. The low P/E ratio suggests current market expectations are muted, implying these levels of growth will not continue.
Investors have an opportunity when market expectations about a stock are wrong. If it is underestimating a company, investors can make money by buying and holding the shares until the market corrects itself. So this free visualization of the analyst consensus on future earnings could help you make the right decision about whether to buy, sell, or hold.
You might be able to find a better buy than Southern. If you want a selection of possible winners, check out this free list of interesting companies that trade on a P/E below 20 (but have proven they can grow earnings).
If you spot an error that warrants correction, please contact the editor at editorial-team@simplywallst.com. This article by Simply Wall St is general in nature. It does not constitute a recommendation to buy or sell any stock, and does not take account of your objectives, or your financial situation. Simply Wall St has no position in the stocks mentioned.
We aim to bring you long-term focused research analysis driven by fundamental data. Note that our analysis may not factor in the latest price-sensitive company announcements or qualitative material. Thank you for reading.
