
 Yahoo Finance
 Here's What Salvatore Ferragamo S.p.A.'s (BIT:SFER) P/E Is Telling Us

Want to participate in a short research study? Help shape the future of investing tools and you could win a $250 gift card!
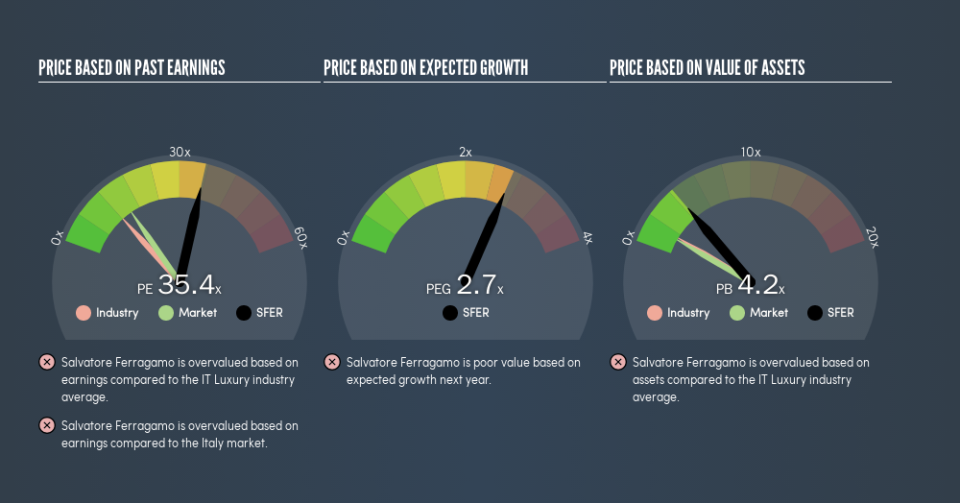
This article is for investors who would like to improve their understanding of price to earnings ratios (P/E ratios). We'll show how you can use Salvatore Ferragamo S.p.A.'s (BIT:SFER) P/E ratio to inform your assessment of the investment opportunity. Based on the last twelve months, Salvatore Ferragamo's P/E ratio is 35.44. In other words, at today's prices, investors are paying €35.44 for every €1 in prior year profit.
Check out our latest analysis for Salvatore Ferragamo
How Do I Calculate A Price To Earnings Ratio?
The formula for P/E is:
Price to Earnings Ratio = Price per Share ÷ Earnings per Share (EPS)
Or for Salvatore Ferragamo:
P/E of 35.44 = €18.78 ÷ €0.53 (Based on the trailing twelve months to March 2019.)
Is A High Price-to-Earnings Ratio Good?
A higher P/E ratio means that buyers have to pay a higher price for each €1 the company has earned over the last year. That is not a good or a bad thing per se, but a high P/E does imply buyers are optimistic about the future.
How Growth Rates Impact P/E Ratios
If earnings fall then in the future the 'E' will be lower. Therefore, even if you pay a low multiple of earnings now, that multiple will become higher in the future. So while a stock may look cheap based on past earnings, it could be expensive based on future earnings.
Salvatore Ferragamo saw earnings per share decrease by 22% last year. And it has shrunk its earnings per share by 10% per year over the last five years. This could justify a pessimistic P/E.
How Does Salvatore Ferragamo's P/E Ratio Compare To Its Peers?
The P/E ratio indicates whether the market has higher or lower expectations of a company. You can see in the image below that the average P/E (12.5) for companies in the luxury industry is lower than Salvatore Ferragamo's P/E.
Its relatively high P/E ratio indicates that Salvatore Ferragamo shareholders think it will perform better than other companies in its industry classification. The market is optimistic about the future, but that doesn't guarantee future growth. So investors should always consider the P/E ratio alongside other factors, such as whether company directors have been buying shares.
A Limitation: P/E Ratios Ignore Debt and Cash In The Bank
One drawback of using a P/E ratio is that it considers market capitalization, but not the balance sheet. Thus, the metric does not reflect cash or debt held by the company. Hypothetically, a company could reduce its future P/E ratio by spending its cash (or taking on debt) to achieve higher earnings.
Spending on growth might be good or bad a few years later, but the point is that the P/E ratio does not account for the option (or lack thereof).
So What Does Salvatore Ferragamo's Balance Sheet Tell Us?
Net debt totals 15% of Salvatore Ferragamo's market cap. It would probably deserve a higher P/E ratio if it was net cash, since it would have more options for growth.
The Bottom Line On Salvatore Ferragamo's P/E Ratio
Salvatore Ferragamo has a P/E of 35.4. That's higher than the average in the IT market, which is 15.5. With a bit of debt, but a lack of recent growth, it's safe to say the market is expecting improved profit performance from the company, in the next few years.
Investors have an opportunity when market expectations about a stock are wrong. As value investor Benjamin Graham famously said, 'In the short run, the market is a voting machine but in the long run, it is a weighing machine.' So this free visual report on analyst forecasts could hold the key to an excellent investment decision.
Of course, you might find a fantastic investment by looking at a few good candidates. So take a peek at this free list of companies with modest (or no) debt, trading on a P/E below 20.
We aim to bring you long-term focused research analysis driven by fundamental data. Note that our analysis may not factor in the latest price-sensitive company announcements or qualitative material.
If you spot an error that warrants correction, please contact the editor at editorial-team@simplywallst.com. This article by Simply Wall St is general in nature. It does not constitute a recommendation to buy or sell any stock, and does not take account of your objectives, or your financial situation. Simply Wall St has no position in the stocks mentioned. Thank you for reading.
