
 Yahoo Finance
 Here's the problem with using 'CAPE' to predict market crashes

Investors and traders like to follow the cyclically-adjusted price-earnings ratio (CAPE), a measure of stock market value popularized by Nobel prize winning economist Robert Shiller.
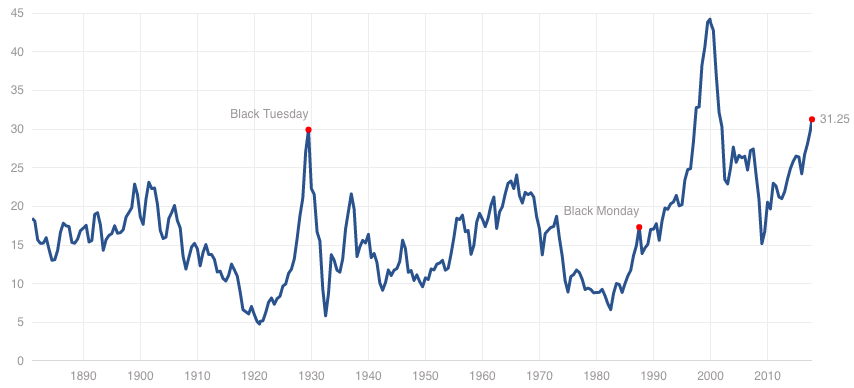
CAPE is calculated by taking the S&P 500 (^GSPC) and dividing it by the average of ten years worth of earnings. It has a long-term average of just over 16. Currently, CAPE is just above 31. Some view this as trouble for the stock market because the only other times CAPE climbed like this was before the market crash of 1929 and the bursting of the tech bubble in the early 2000s.
DoubleLine Capital’s deputy CIO Jeffrey Sherman, who runs a CAPE fund, explained why investors shouldn’t be using CAPE to time market crashes.
“The problem is we have this small sample size issue,” he tells Yahoo Finance in the video above. “What I mean by that, is historically the CAPE ratio has only achieved this level of north of 30 two times previous to the current environment.”
It’s hard to justify statistical significance with a sample size of two. Furthermore, a closer look shows that the market behaved very differently in each of those two occurrences.
“A lot of people are portending this high valuation metric of signaling an impending doom or crash to the markets,” Sherman says. “We’ve only had two instances where it’s been at this level. And in one case, you made a lot of money before the eventual collapse of the stock market, and in one case it happened quite quickly.”
No one can time the market, he added.
“[CAPE] is a valuation metric,” he said. “And so what do valuation metrics tell you? They have a way of valuing future returns.”
When valuations are above-average, it means you should expect below-average returns. When they’re below-average, you should expect above-average returns. Not surprisingly, when the valuation is average, you should expect an average return, he explained.
“What the CAPE ratio is telling us is that we should expect low-average returns going forward at least over the next ten year kind of window if history is any guide,” Sherman says. “Now that said, it’s still a positive number. It’s talking about a couple of percent in real terms, so that means after adjusted for inflation. So perhaps we’re talking about an annualized return of maybe, you know, in the 3 to 5% range. Still a positive rate of return but nothing that people are used to in the stock market.”
Sherman manages the DoubleLine Stiller Enhanced Cape (DSEEX) fund. Since the fund’s inception in late 2013, it has beaten the S&P 500. At the time of this writing, the fund’s year-to-date return was 15.08% compared to the S&P 500’s 14.40% gain.
Listen to the full interview:
—
Julia La Roche is a finance reporter at Yahoo Finance. Follow her on Twitter.
