
 Yahoo Finance
 Here's How P/E Ratios Can Help Us Understand SmartFinancial, Inc. (NASDAQ:SMBK)

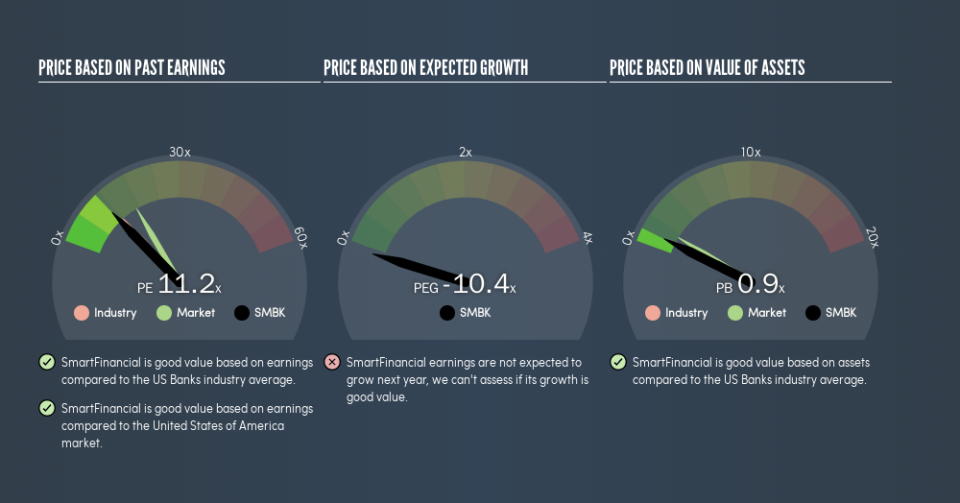
This article is for investors who would like to improve their understanding of price to earnings ratios (P/E ratios). We'll look at SmartFinancial, Inc.'s (NASDAQ:SMBK) P/E ratio and reflect on what it tells us about the company's share price. Based on the last twelve months, SmartFinancial's P/E ratio is 11.16. In other words, at today's prices, investors are paying $11.16 for every $1 in prior year profit.
Check out our latest analysis for SmartFinancial
How Do I Calculate A Price To Earnings Ratio?
The formula for price to earnings is:
Price to Earnings Ratio = Share Price ÷ Earnings per Share (EPS)
Or for SmartFinancial:
P/E of 11.16 = $20.27 ÷ $1.82 (Based on the trailing twelve months to June 2019.)
Is A High Price-to-Earnings Ratio Good?
A higher P/E ratio means that buyers have to pay a higher price for each $1 the company has earned over the last year. That is not a good or a bad thing per se, but a high P/E does imply buyers are optimistic about the future.
Does SmartFinancial Have A Relatively High Or Low P/E For Its Industry?
The P/E ratio indicates whether the market has higher or lower expectations of a company. If you look at the image below, you can see SmartFinancial has a lower P/E than the average (12.2) in the banks industry classification.
SmartFinancial's P/E tells us that market participants think it will not fare as well as its peers in the same industry. Since the market seems unimpressed with SmartFinancial, it's quite possible it could surprise on the upside. You should delve deeper. I like to check if company insiders have been buying or selling.
How Growth Rates Impact P/E Ratios
Probably the most important factor in determining what P/E a company trades on is the earnings growth. If earnings are growing quickly, then the 'E' in the equation will increase faster than it would otherwise. And in that case, the P/E ratio itself will drop rather quickly. So while a stock may look expensive based on past earnings, it could be cheap based on future earnings.
SmartFinancial's 112% EPS improvement over the last year was like bamboo growth after rain; rapid and impressive. The cherry on top is that the five year growth rate was an impressive 16% per year. With that kind of growth rate we would generally expect a high P/E ratio.
Don't Forget: The P/E Does Not Account For Debt or Bank Deposits
Don't forget that the P/E ratio considers market capitalization. That means it doesn't take debt or cash into account. Hypothetically, a company could reduce its future P/E ratio by spending its cash (or taking on debt) to achieve higher earnings.
Such expenditure might be good or bad, in the long term, but the point here is that the balance sheet is not reflected by this ratio.
So What Does SmartFinancial's Balance Sheet Tell Us?
SmartFinancial has net cash of US$133m. This is fairly high at 47% of its market capitalization. That might mean balance sheet strength is important to the business, but should also help push the P/E a bit higher than it would otherwise be.
The Bottom Line On SmartFinancial's P/E Ratio
SmartFinancial's P/E is 11.2 which is below average (17) in the US market. It grew its EPS nicely over the last year, and the healthy balance sheet implies there is more potential for growth. The below average P/E ratio suggests that market participants don't believe the strong growth will continue.
Investors have an opportunity when market expectations about a stock are wrong. As value investor Benjamin Graham famously said, 'In the short run, the market is a voting machine but in the long run, it is a weighing machine.' So this free visual report on analyst forecasts could hold the key to an excellent investment decision.
You might be able to find a better buy than SmartFinancial. If you want a selection of possible winners, check out this free list of interesting companies that trade on a P/E below 20 (but have proven they can grow earnings).
We aim to bring you long-term focused research analysis driven by fundamental data. Note that our analysis may not factor in the latest price-sensitive company announcements or qualitative material.
If you spot an error that warrants correction, please contact the editor at editorial-team@simplywallst.com. This article by Simply Wall St is general in nature. It does not constitute a recommendation to buy or sell any stock, and does not take account of your objectives, or your financial situation. Simply Wall St has no position in the stocks mentioned. Thank you for reading.
